- Solid Economic Growth Amid Labor Market Weakness: The economy continues to power ahead, though growth in the labor market has decelerated. Encouragingly, stronger productivity growth is filling this gap.
- Fed Policy Shifts Back to Easing: The Fed resumed rate cuts in September amid balanced concerns over supply- and demand-led softening in the labor market. Future rate cuts are expected, but uncertainty about how many remains high among market participants as well as the Fed.
- Credit Market Resilience and Investment Shifts: Credit markets are showing few signs of stress, supported by strong corporate balance sheets and a slower pace of issuance.
- Elevated Market Valuations: Equity market valuations, especially in the top market capitulation “Mag7” cohort of the market, have risen to historically elevated levels, while market concentration is also at historically high levels.
They know that overstaying the festivities—that is, continuing to speculate in companies that have gigantic valuations relative to the cash they are likely to generate in the future—will eventually bring on pumpkins and mice. But they nevertheless hate to miss a single minute of what is one helluva party. Therefore, the giddy participants all plan to leave just seconds before midnight. There’s a problem, though: They are dancing in a room in which the clocks have no hands.
– Warren Buffett, Shareholder Letter, 2000
The great difficulty is timing, which the above quote from Warren Buffet succinctly highlights. When Fed Chairman Alan Greenspan famously made his “irrational exuberance” speech in December 1996, this was still almost three and a half years before the stock market finally peaked, which is when the market was 107% higher than at the time of his speech. Over the next two years, the market subsequently retraced its steps with a 49% drawdown, leaving it still slightly ahead of its level when Chairman Greenspan made his comments.
At William Blair, we also do not profess to be market timers, though we believe in quality growth investing and that valuations matter—with the result that in times of higher valuations and greater uncertainty, diversification and resiliency are often a sensible choice, even at the risk of slightly lower near-term performance. This may include looking at other asset classes or at other previously unloved but still high-quality areas of the equity market, including across both sectors and size.
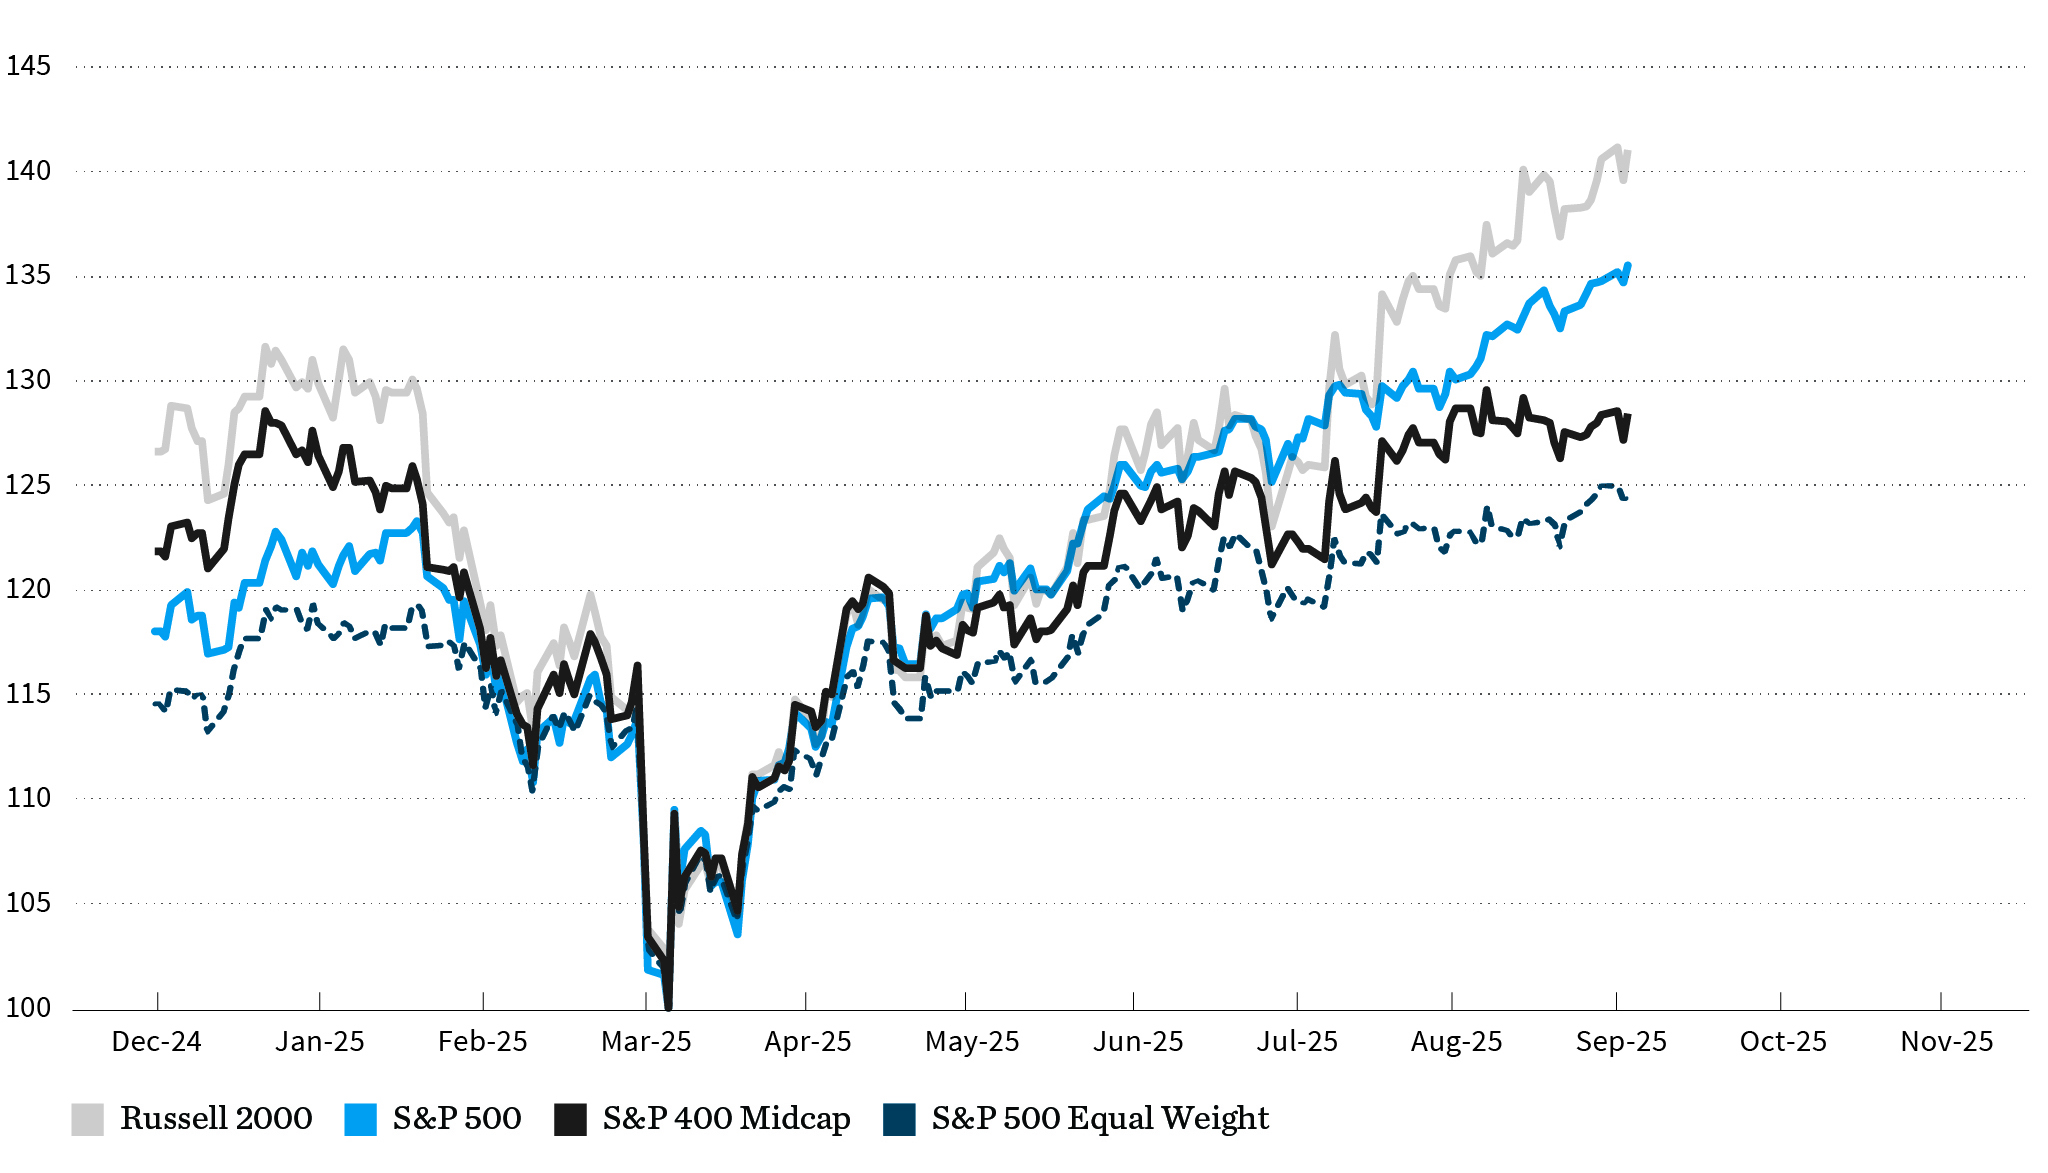
Exhibit 2 shows the performance of the major U.S. indices by size (rebased to 100 at this year’s market low on 8 April) and is already suggesting that investors are starting to pursue this approach. Since that low, the best performing index has been the small-cap Russell 2000, followed by the S&P 500, the S&P SmallCap 600, the S&P MidCap 400, and as laggard, the equally weighted S&P 500. We believe this implies that investors are keeping a foot in the door of the mega-cap AI-related stocks, but the equally weighted index as the worst performer suggests they are starting to take more of a barbell approach and looking toward smaller-cap stocks for growth and diversification.
Stock Market Performance by Size
(Rebased to 100 at 8 April 2025)

Economic Growth Strange Kind of Softening
The economy’s performance over the past quarter has arguably been much better than feared following the imposition of the trade tariffs, with GDP increasing by an estimated 3.8%, according to the Atlanta Fed’s GDPNow tracker, mirroring the 3.8% increase in the previous quarter.
Much of this growth has been driven by business investment, with the consumer being less of the marginal driver of growth this time around. While it is the case that a large contribution of the investment has been related to the rollout of AI and AI-related energy infrastructure, we are starting to see more nascent signs of a broadening in capital investment across other areas. This is being aided by the need for productivity growth due to ongoing structural labor shortages, in addition to government legislation contained in the $3.4 trillion One Big Beautiful Bill Act, which passed on the Fourth of July.
However, the economy’s performance has disappointed in one key area—the labor market. Nonfarm payroll growth in the quarter averaged just 51,000 in July and August (September’s data has been delayed due to the government shutdown), which is below the 83,000 through the first half of the year and the 168,000 monthly gain in 2024.
It might be easy to lay the blame for this on the demand side of the economy as increased uncertainty related to the tariffs and other geopolitical woes are causing companies to take a more cautious stance on investing in labor. However, the reality is that the supply side (the pool of available labor) has also been reduced as a result of both demographic factors (low birth rates and an aging labor force) and immigration restrictions. With the result that the unemployment rate has likely risen less today than might have been the case in the past given a similar decline in demand against a still abundant pool of labor.
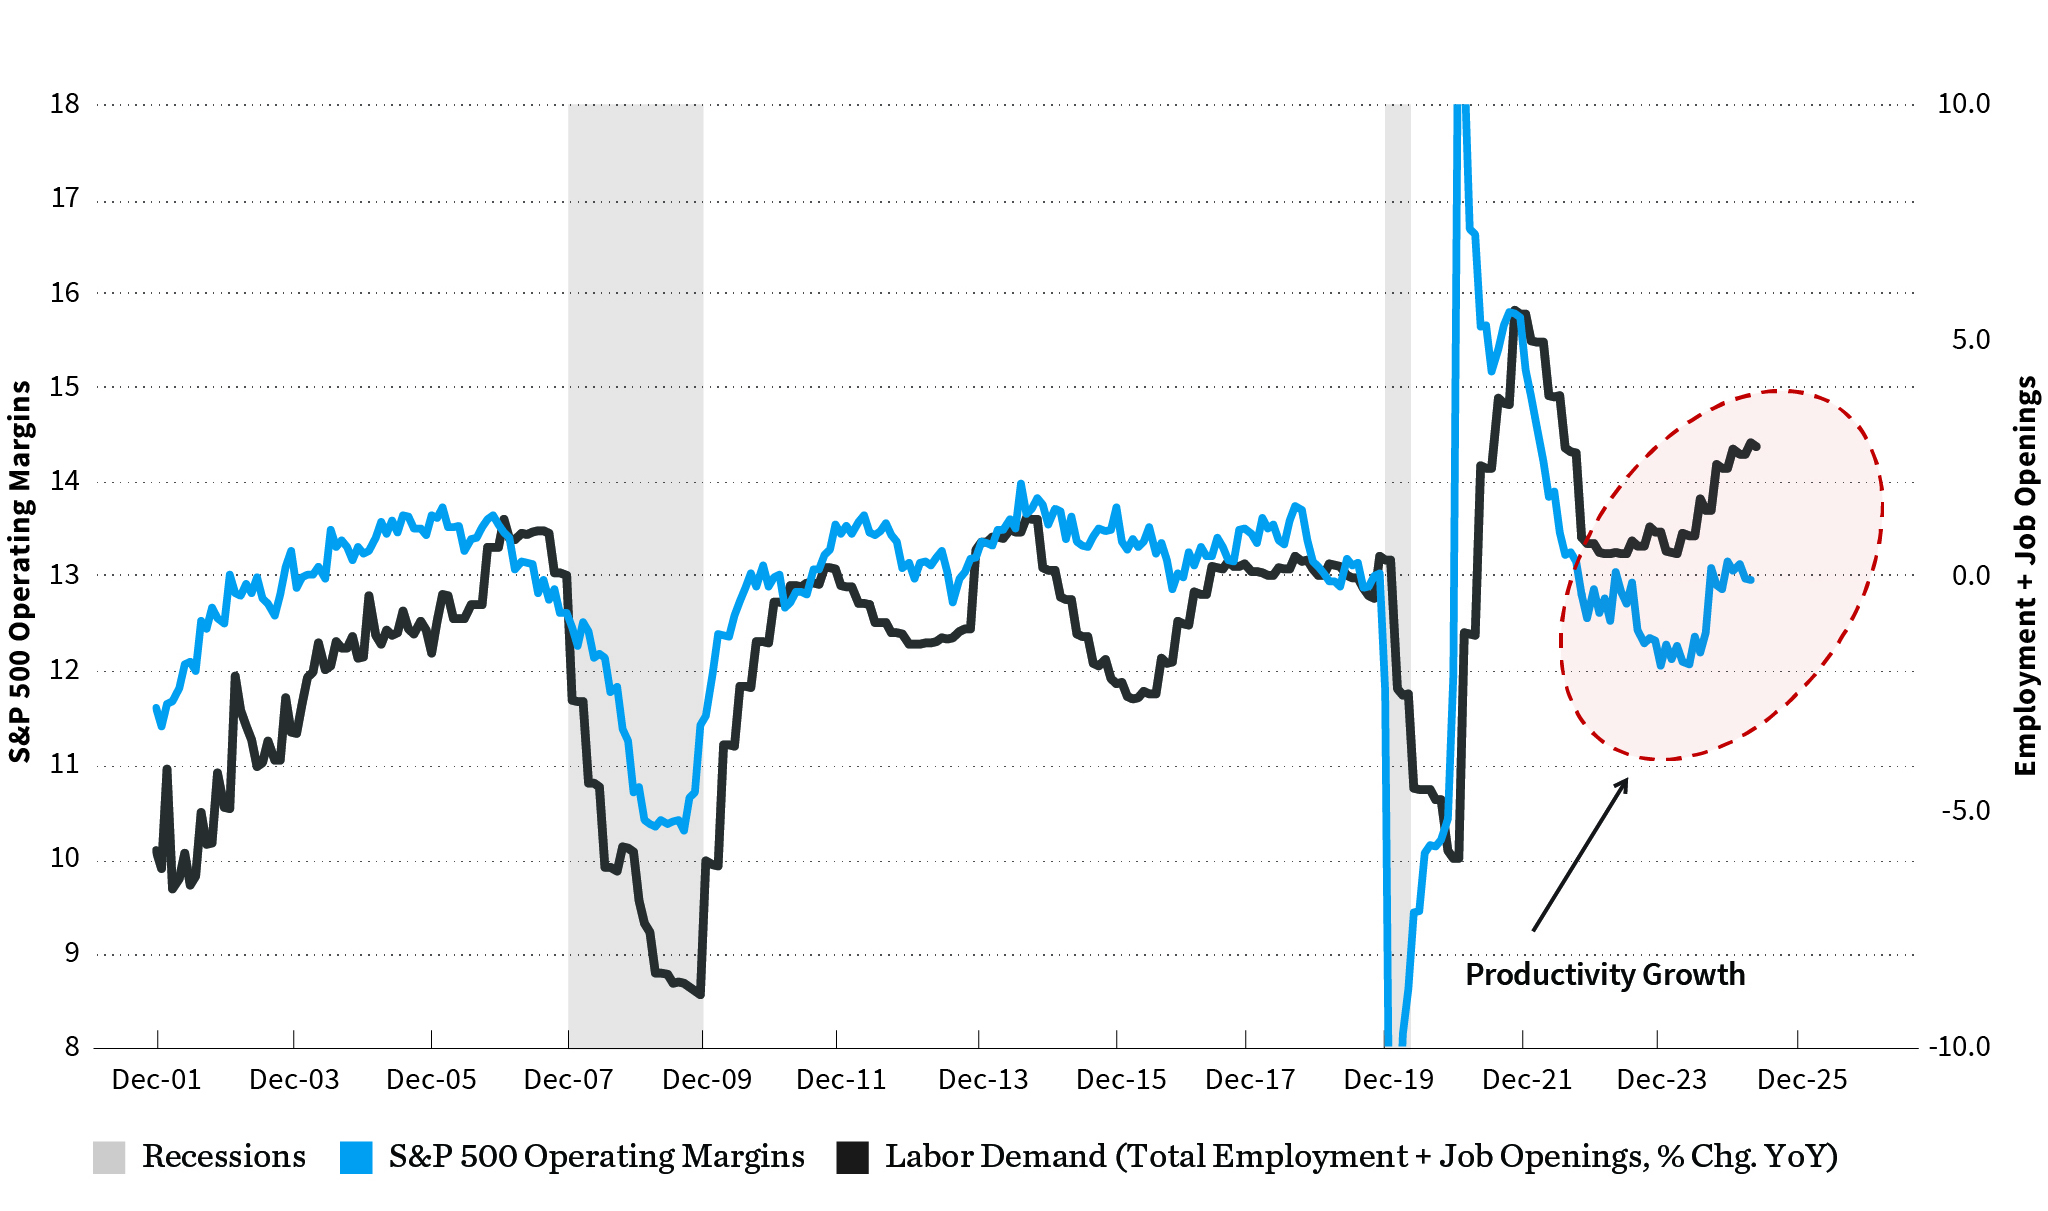
Nevertheless, we have started to see a growing gap between corporate profit margins and the demand for labor. Productivity growth is filling this gap, which is encouraging and something that the economy has been sorely lacking for many years now (exhibit 3).
S&P 500 Operating Margins vs. Labor Demand Growth, %

Fed Resumes Easing, as Inflation Concerns Diminish
Whether the softening is demand- or supply-led matters deeply to the Fed when it comes to thinking about the impact on the economy and inflation. If it is mostly supply-led, a shortage of workers in the face of still solid demand can lead to higher inflation and less need for lower interest rates. Whereas with a demand-led slowdown, it is exactly the opposite. Fed Chair Jerome Powell’s stance is that the two have been fairly equally balanced, but the fear is this may not remain the case for much longer, hence the need to start removing any policy restrictiveness.
The Fed began this process in September with its first rate cut since December 2024. The futures market currently anticipates two further rate cuts in 2025 and three more in 2026. However, there is still a high degree of uncertainty around these expectations across market participants and within the Fed itself—which is something we can see in both the wide dispersion of rate expectations contained in the Fed’s dot plot survey and the number of dissentions among the voting members.
Credit Markets Showing Few Signs of Stress
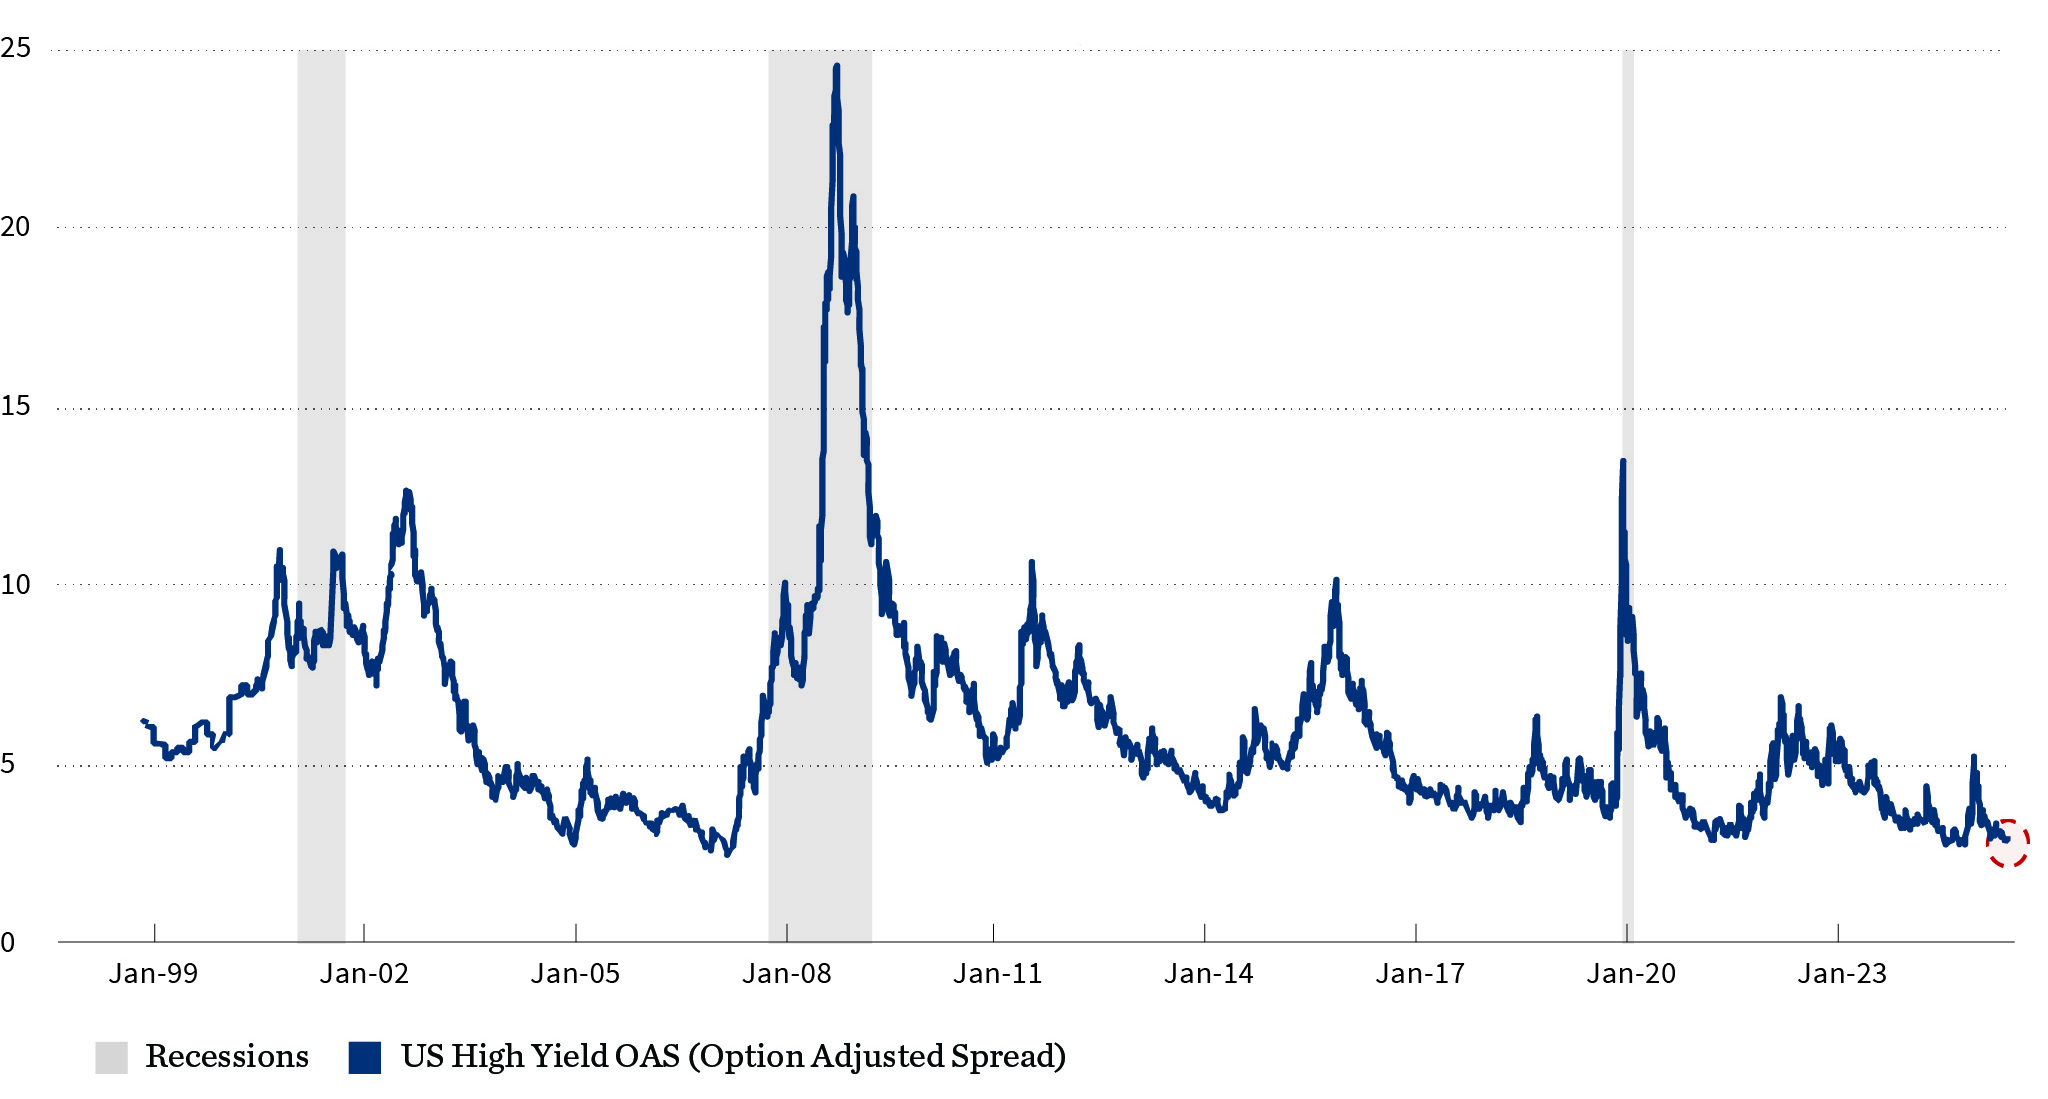
One of the areas of the market that continues to surprise investors has been the continued buoyancy of credit markets, particularly in the high-yield markets. Spreads here have been exceptionally low, and while some are attributing this to complacency, it is likely reflecting that the economic expansion we have been witnessing, whether AI-related or in other areas, has not been a debt-fueled expansion. Debt ratios for corporate balance sheets are about the best they have been in decades. Some of this is due to high equity valuations, but other gauges that, for example, look at the amount of liquid assets on balance sheets are also indicative of resiliency. Furthermore, the volume of debt issuance has notably been trending lower over the last decade. Hence, to the extent that the corporate bond market is an early warning signal of impending economic weakness, current readings are not indicative of any major stress.
U.S. High Yield Credit Spread
(Bloomberg US High Yield Option Adjusted Spread)

Investing Amid High Valuations
High valuations are increasingly a concern among investors. This is unsurprising given the speed and scale at which equity prices have increased (15% year to date and an 87% increase in the S&P 500 since the October 2022 low). Further, most gauges of stock market valuation are hitting near historically high levels (e.g., the cyclically adjusted P/E ratio of 39x).
These valuations imply that investors have been discounting expected growth increasingly further into the future, and/or extrapolating the continuation of very high rates of growth over a more compressed period. Yet, as we know, the future is inherently uncertain, and the further into the future investors attempt to extrapolate, the more uncertainty and risk they are taking.
Taking on increased uncertainty and risk is not necessarily a bad thing, after all it is the very nature of investing—taking calculated risks that will hopefully be rewarded in the future. What investors need to assess, however, is whether they are demanding and receiving a sufficient risk premium (the extra return above that generated by investing in a “safe” asset such as a U.S. Treasury bond) for the risk they are taking.
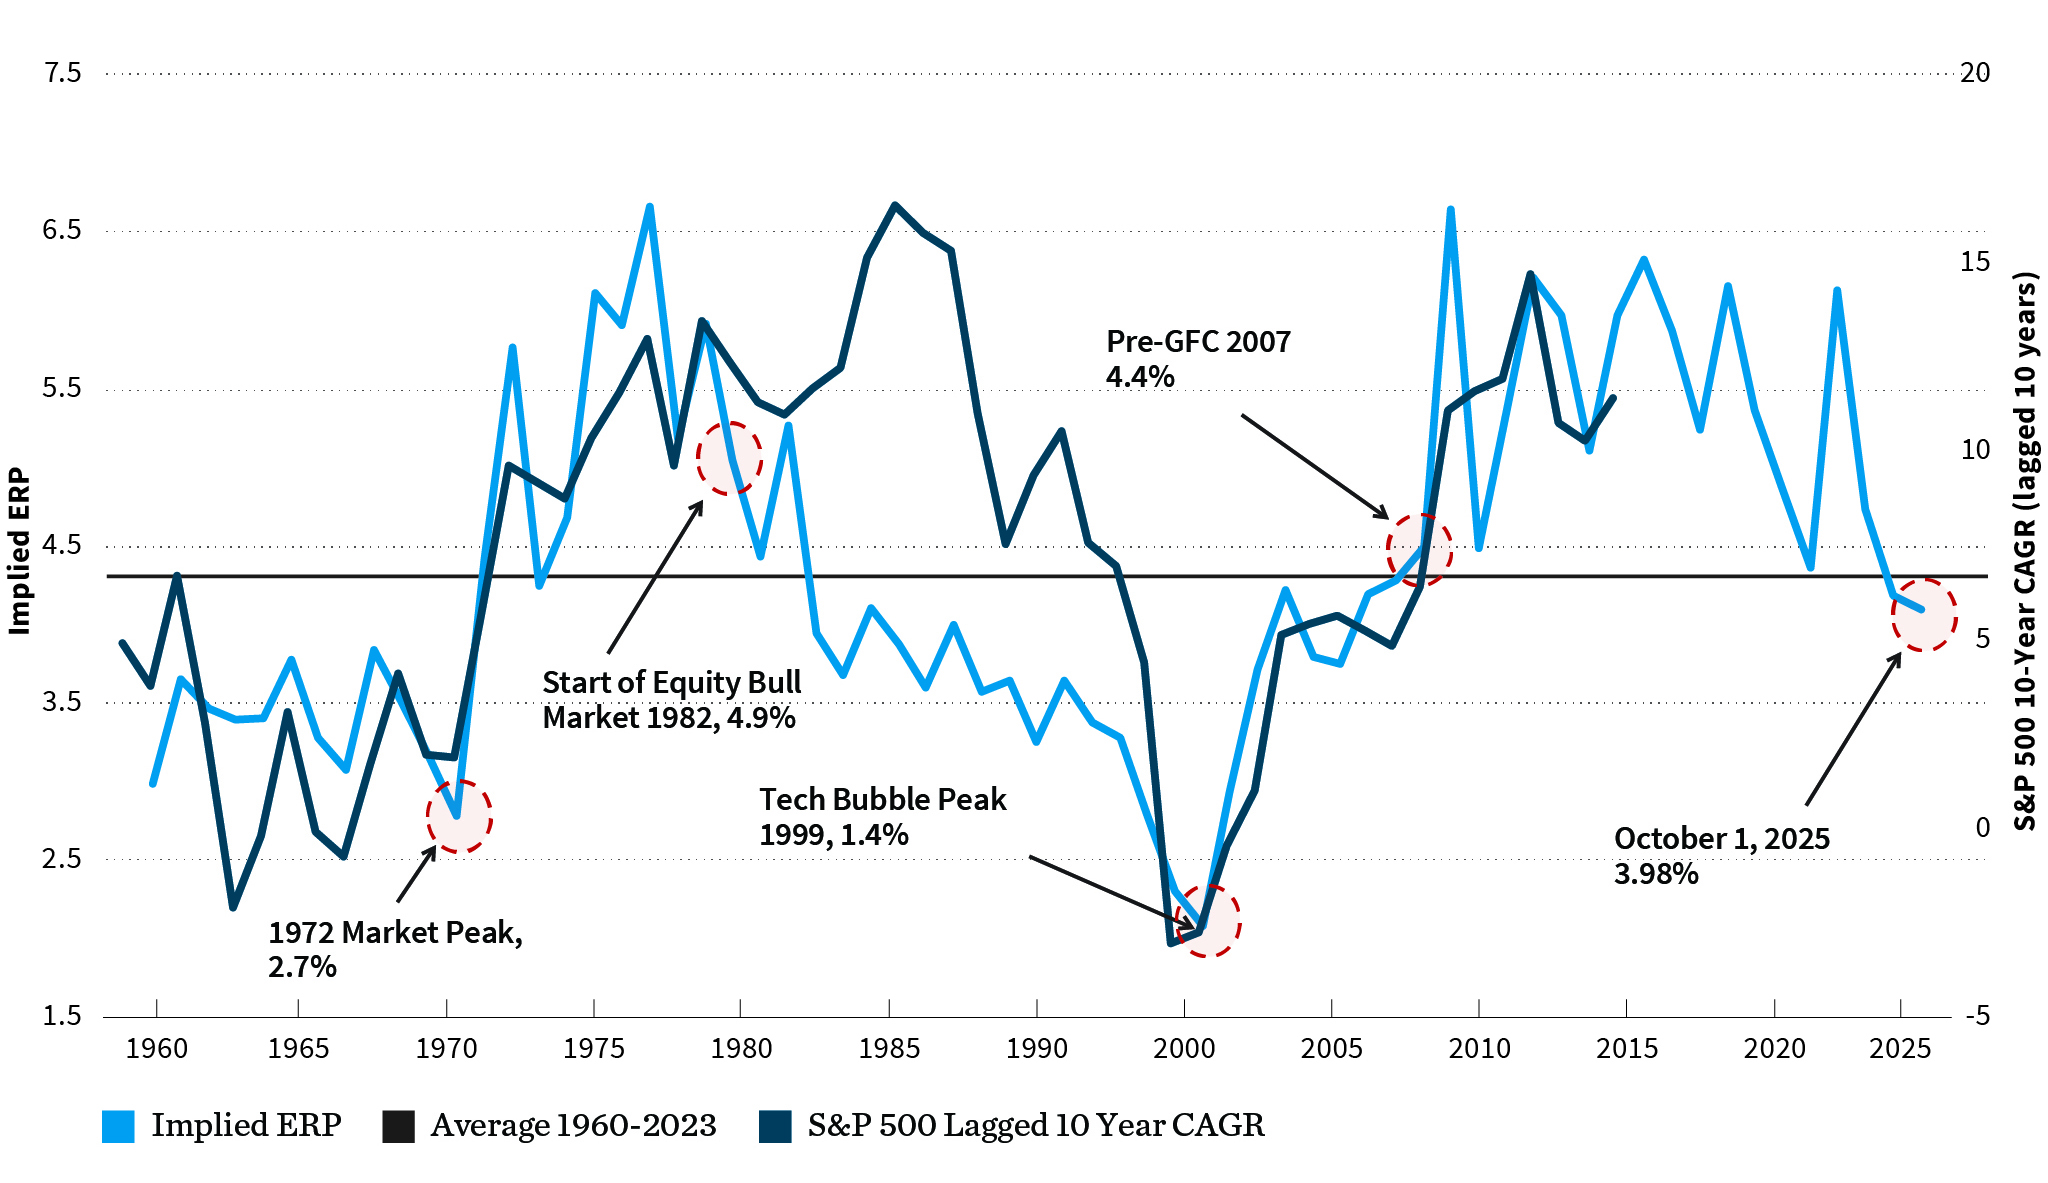
While there is no end of ways to measure this risk premium, we use Professor Aswath Damodaran’s implied equity risk premium, which takes a forward-looking approach to earnings growth and cash flow relative to the current 10-year T-Note yield. The result, depicted in exhibit 1, shows that investors are demanding a much lower premium than they have been in the last 15 years, but the demanded premium of 4.0% is still only just below the historical average. Notably, it is not where it was in 1999, which can be considered a textbook equity market bubble.
Implied Equity Risk Premium vs. S&P 500 10-Year CAGR Lagged 10 Years, %
S&P 500 10-Year CAGR (lagged 10 years)

As we move into the 4th quarter of the year and mindful of all these moving parts in the market, we are focused and disciplined as always on managing your investment portfolios with high quality assets and, importantly, within a risk-profile customized to your goals and objectives. We look forward to our meetings and conversations together as we move into the holiday season and year-end.
Thank you for your trust and confidence.
| Index | YTD | 3Q | 1Y | |
|---|---|---|---|---|
| S&P 500 | U.S. Large Cap | 14.83% | 8.12% | 17.60% |
| DJIA | U.S. Large Cap | 10.47 | 5.67 | 11.50 |
| Russell 3000 | U.S. All Cap | 14.40 | 8.18 | 17.41 |
| Russell 2000 | U.S. Small Cap | 10.39 | 12.39 | 10.76 |
| MSCI EAFE | Developed International | 25.14 | 4.77 | 14.99 |
| MSCI EM | Emerging Markets | 27.53 | 10.64 | 17.32 |
| Bloomberg U.S. HY | U.S. High Yield | 7.22 | 2.54 | 7.41 |
| Bloomberg U.S. Agg | U.S. Core Bond | 6.13 | 2.03 | 2.88 |
| Bloomberg Muni | U.S. Muni Bond | 2.64 | 3.00 | 1.39 |
| MSCI U.S. REIT GR | U.S. Real Estate | 4.72 | 4.81 | -1.69 |
Total Returns
Source: William Blair, FactSet


