In 2023, the global economy defied widespread expectations of a recession and falling interest rates. Instead, the United States, Japan, and, to a lesser extent, Europe delivered significantly better growth than was expected at the turn of the year, even as the U.S. Federal Reserve (Fed) and the European Central Bank (ECB) continued to raise policy rates through most of the year.
Underappreciated economic growth is powerful fuel for global equities: the performance of the U.S. “Magnificent 7” stocks (Apple, Microsoft, Alphabet, Amazon, Nvidia, Meta, and Tesla) is widely discussed, but as of November 30, 2023, German, Spanish, and Italian bourses1 also returned 19.1%, 29.9%, and 34.4%, respectively, in U.S. dollar terms. This is in line with or better than 17.28% for the S&P 500 Index. Even Japanese equities2 are up at double-digit rates in U.S. dollar terms, despite the Japanese yen depreciating to lows last observed in the early 1990s.
EM Growth Depends on Three Developed Demand Centers
The vast majority of emerging markets (EMs) are small, open economies whose fortunes depend on what happens in the world’s three principal demand centers: the United States, Europe, and China. Put another way, EMs are a high-beta play on developed market growth. Interest rates, exchange rates, and commodity prices are largely set by the economic and liquidity conditions in the three global demand centers. At the same time, these prices—interest rates, exchange rates, and commodity prices—set binding constraints on economic outcomes in most EMs.
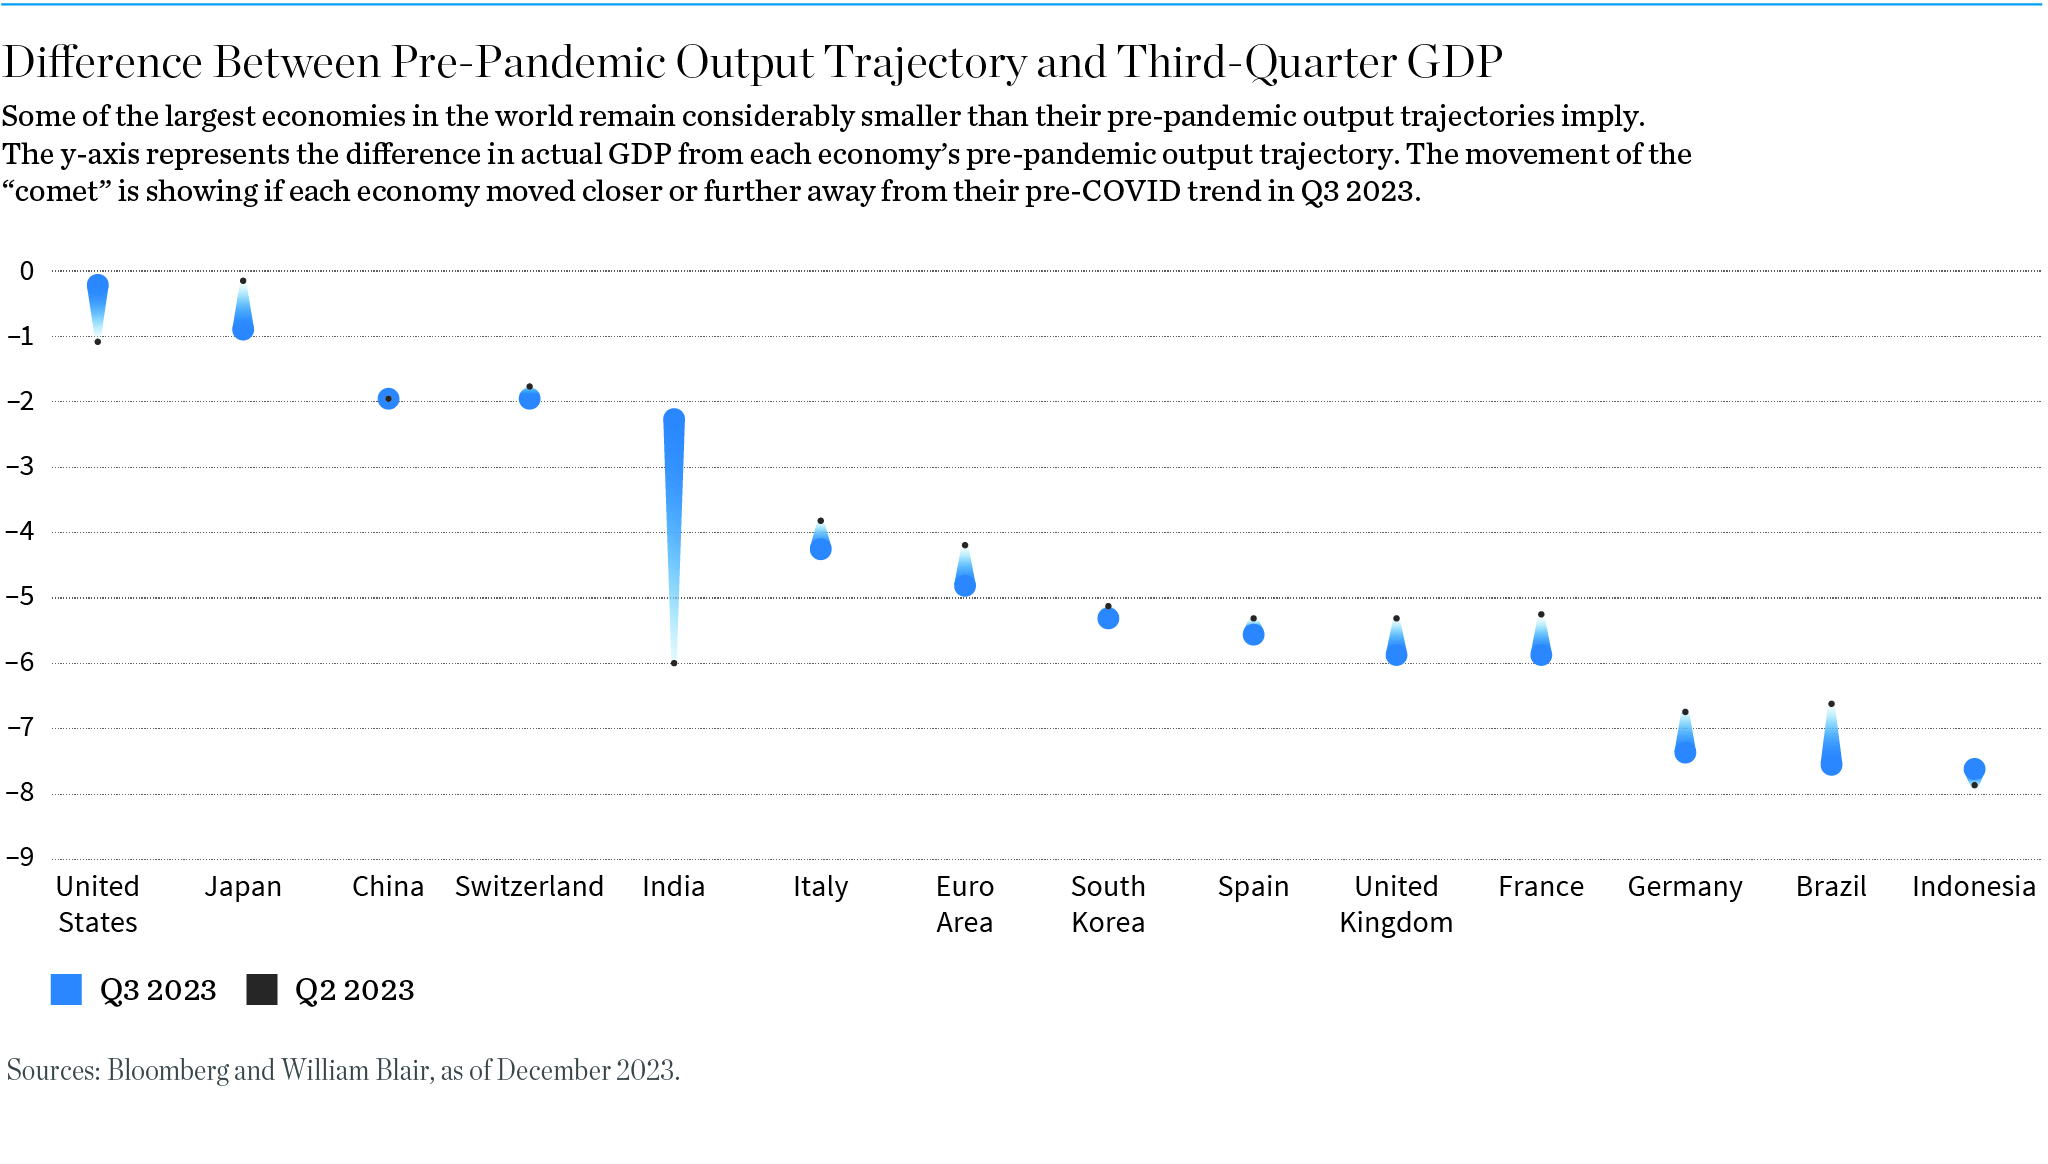
To be sure, the world economy has some ground to cover. At the end of 2023, many of the largest economies remain significantly smaller than their pre-COVID growth trajectory implies, as shown in exhibit 1.
Difference Between Pre-Pandemic Output Trajectory and Third-Quarter GDP
Source: Bloomberg and William Blair, as of December 2023
The United States and Japan are the closest, while the United Kingdom, Germany, and Indonesia are among the furthest away from their pre-pandemic output trajectory.
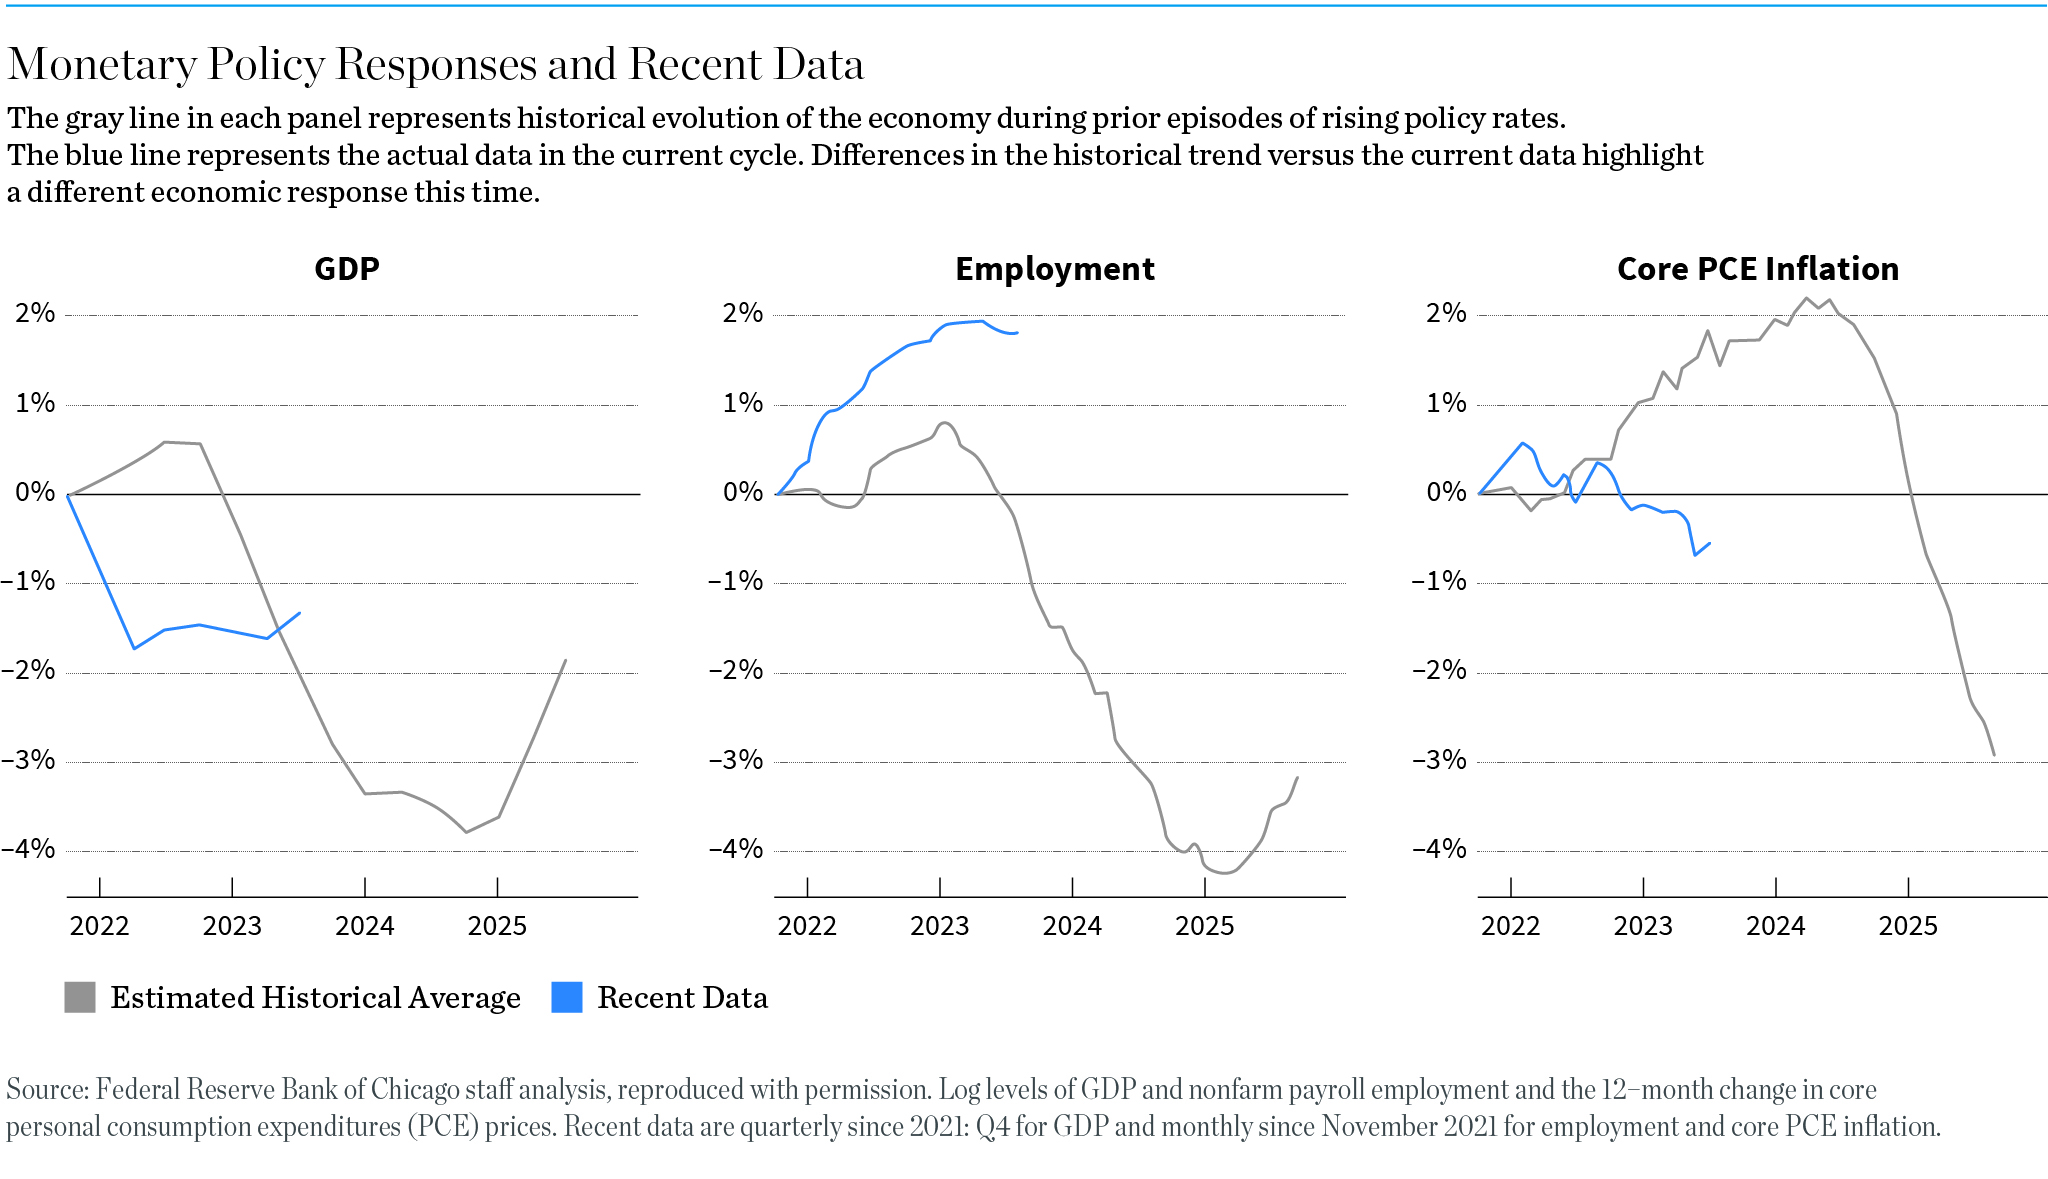
The experience in 2023 has defied the commonplace view of an inevitable trade-off between inflation and unemployment. Many continue to argue that for inflation to decline to the 2% range, the economy needs to shrink and unemployment needs to rise. This view assumes that the run-up in inflation over the last two years is due mainly to excessive demand growth.
In exhibit 2 below, analysis by the Federal Reserve Bank of Chicago shows just how differently U.S. economic variables are behaving in the aftermath of the Fed’s tightening policy and makes a powerful argument that inflation this time was primarily due to pandemic-induced supply constraints. Viewed in this light, it is hardly surprising that both the United States and Europe have defied dire predictions of an imminent recession so far.
Monetary Policy Responses and Recent Data
Source: Federal Reserve Bank of Chicago staff analysis, reproduced with permission. Log levels of GDP and nonfarm payroll employment and the 12−month change in core personal consumption expenditures (PCE) prices. Recent data are quarterly since 2021: Q4 for GDP and monthly since November 2021 for employment and core PCE inflation.
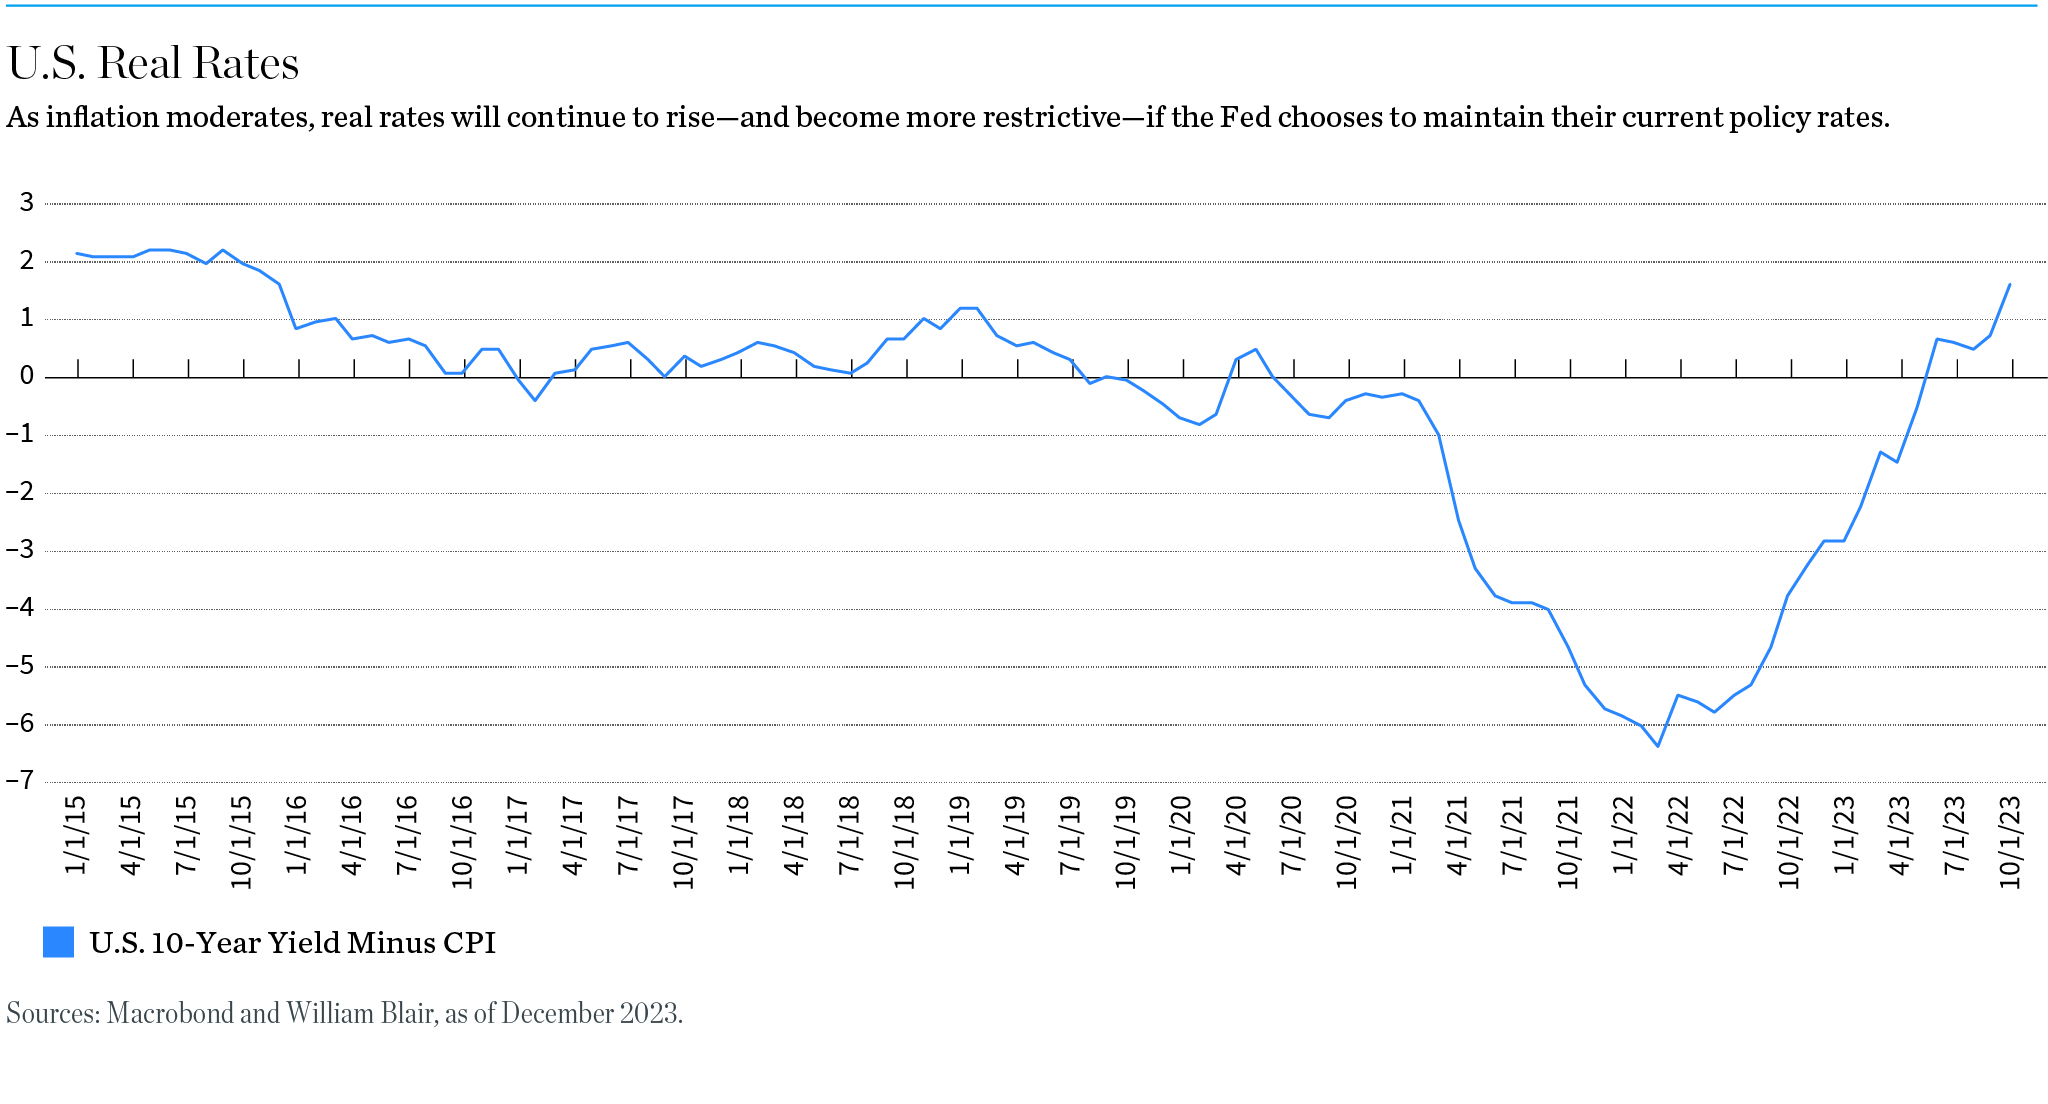
The Fed’s monetary policy stance is becoming de facto more restrictive, as stable policy rates amid rapidly falling inflation imply rising real rates. Our outlook for 2024 hinges on whether the Fed and the ECB can begin to lower policy rates early enough to prevent high accurate rates from meaningfully dampening economic activity. As annual price inflation converges back to a 2% rate in the early months of 2024, current monetary policy, as measured by real interest rates, will become de facto more restrictive. The real interest rate is nothing more than nominal rates minus inflation. Thus, lower inflation automatically means higher real rates if the Fed chooses to maintain current settings. Therefore, we expect the Fed to begin to lower the nominal policy rate as early as the first half of 2024, even as domestic economic growth remains resilient.
We expect the Fed to begin to lower the nominal policy rate as early as the first half of 2024, even as domestic economic growth remains resilient.
OLGA BITEL, Partner
U.S. Real Rates
Sources: Macrobond and William Blair, as of December 2023.
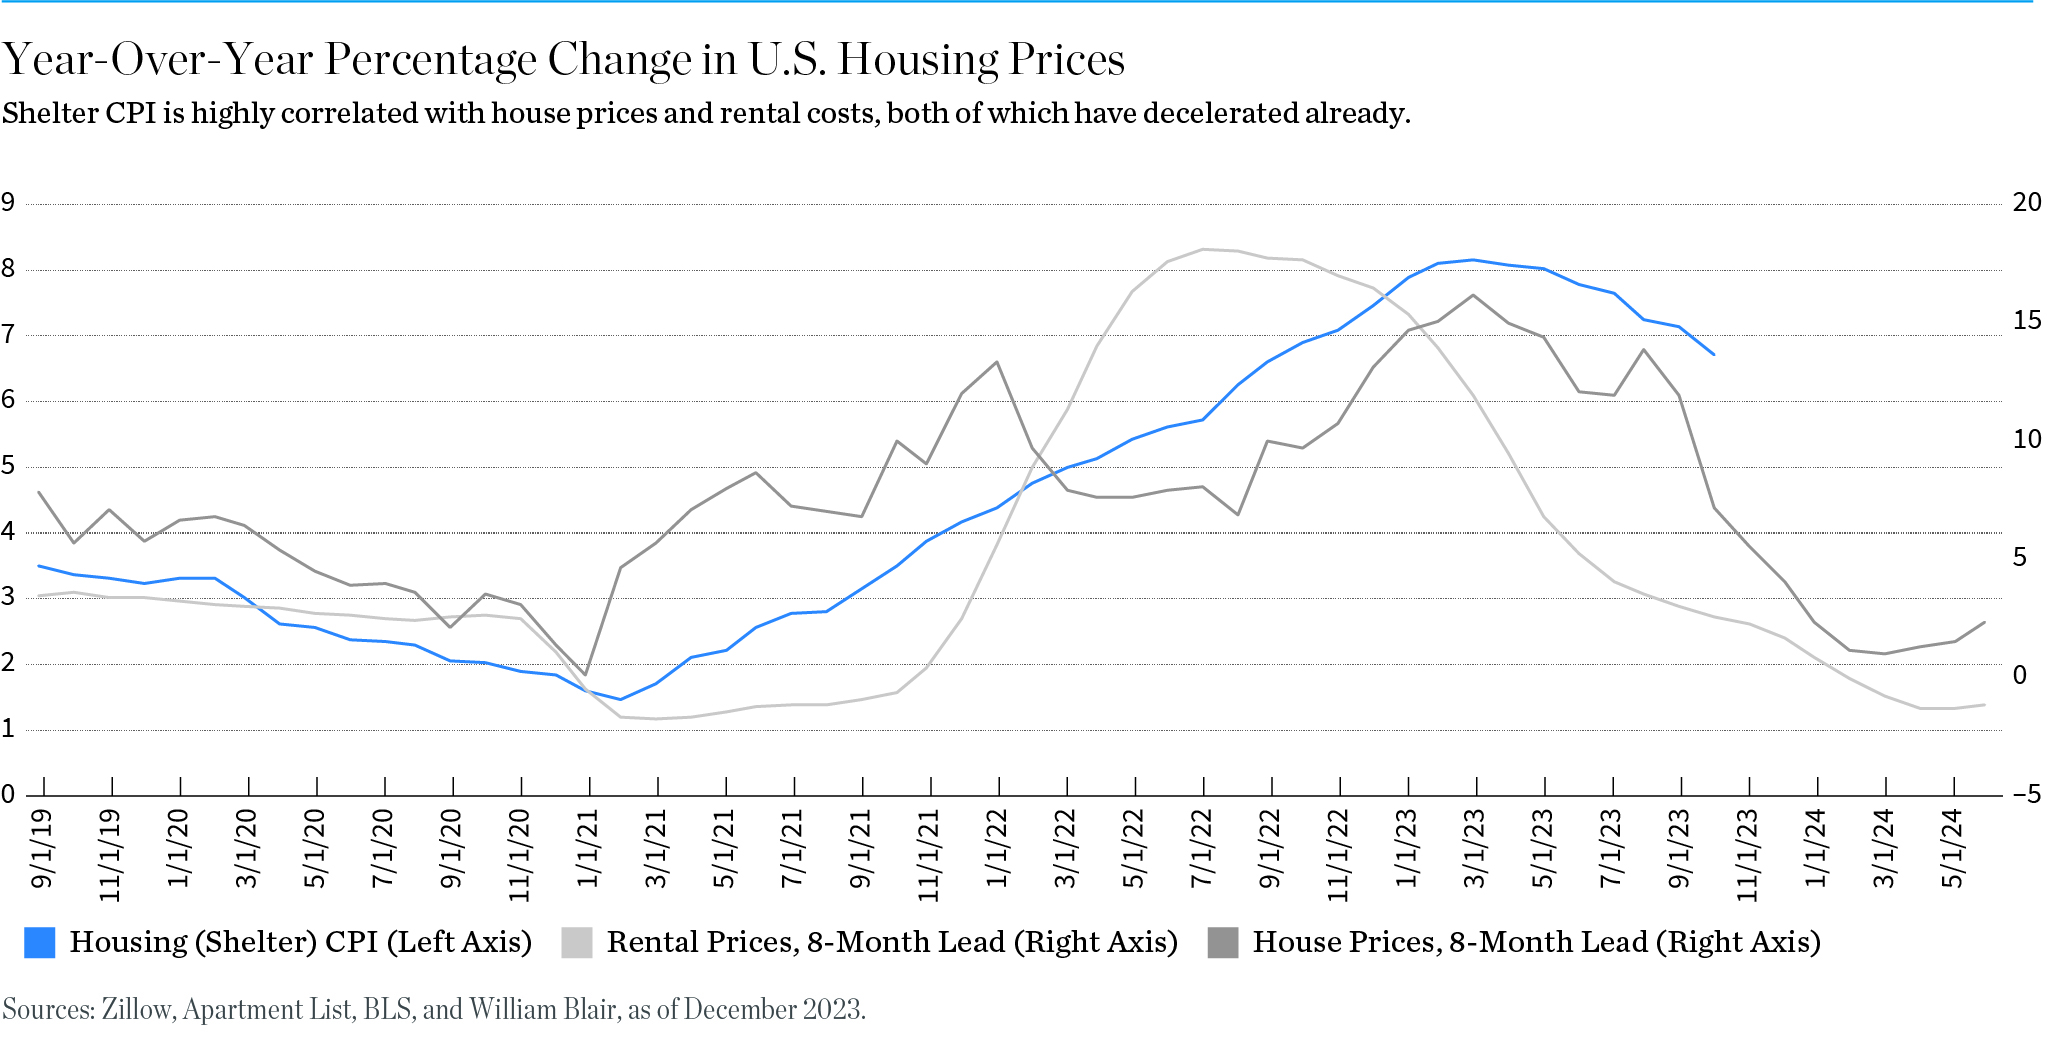
The disinflation process in the United States and Europe is already well advanced. At the beginning of 2023, consumer prices rose by 6% year-over-year. By the end of the year, the Consumer Price Index (CPI) registered year-on-year increases of 3.2%. Nevertheless, the Fed’s preferred gauge of domestic inflation—PCE excluding food and energy, which tend to be volatile—is still growing at 3.8% as of September 2023, nearly twice the 2% stated goal of the Fed. A closer look at the components of the price increases suggests that the principal offender remains housing. It is the single largest component of the CPI basket, weighing roughly one-third of the index. The housing component of the CPI is an imprecise blend of housing prices and rent costs. Online platforms for home purchasing and rents now make more current pricing information readily available, and these price trends suggest that the contribution of housing to the CPI is likely to diminish significantly in the first half of 2024, as shown in exhibit 4.
Year-Over-Year Percentage Change in U.S. Housing Prices
Sources: Zillow, Apartment List, BLS, and William Blair, as of December 2023.
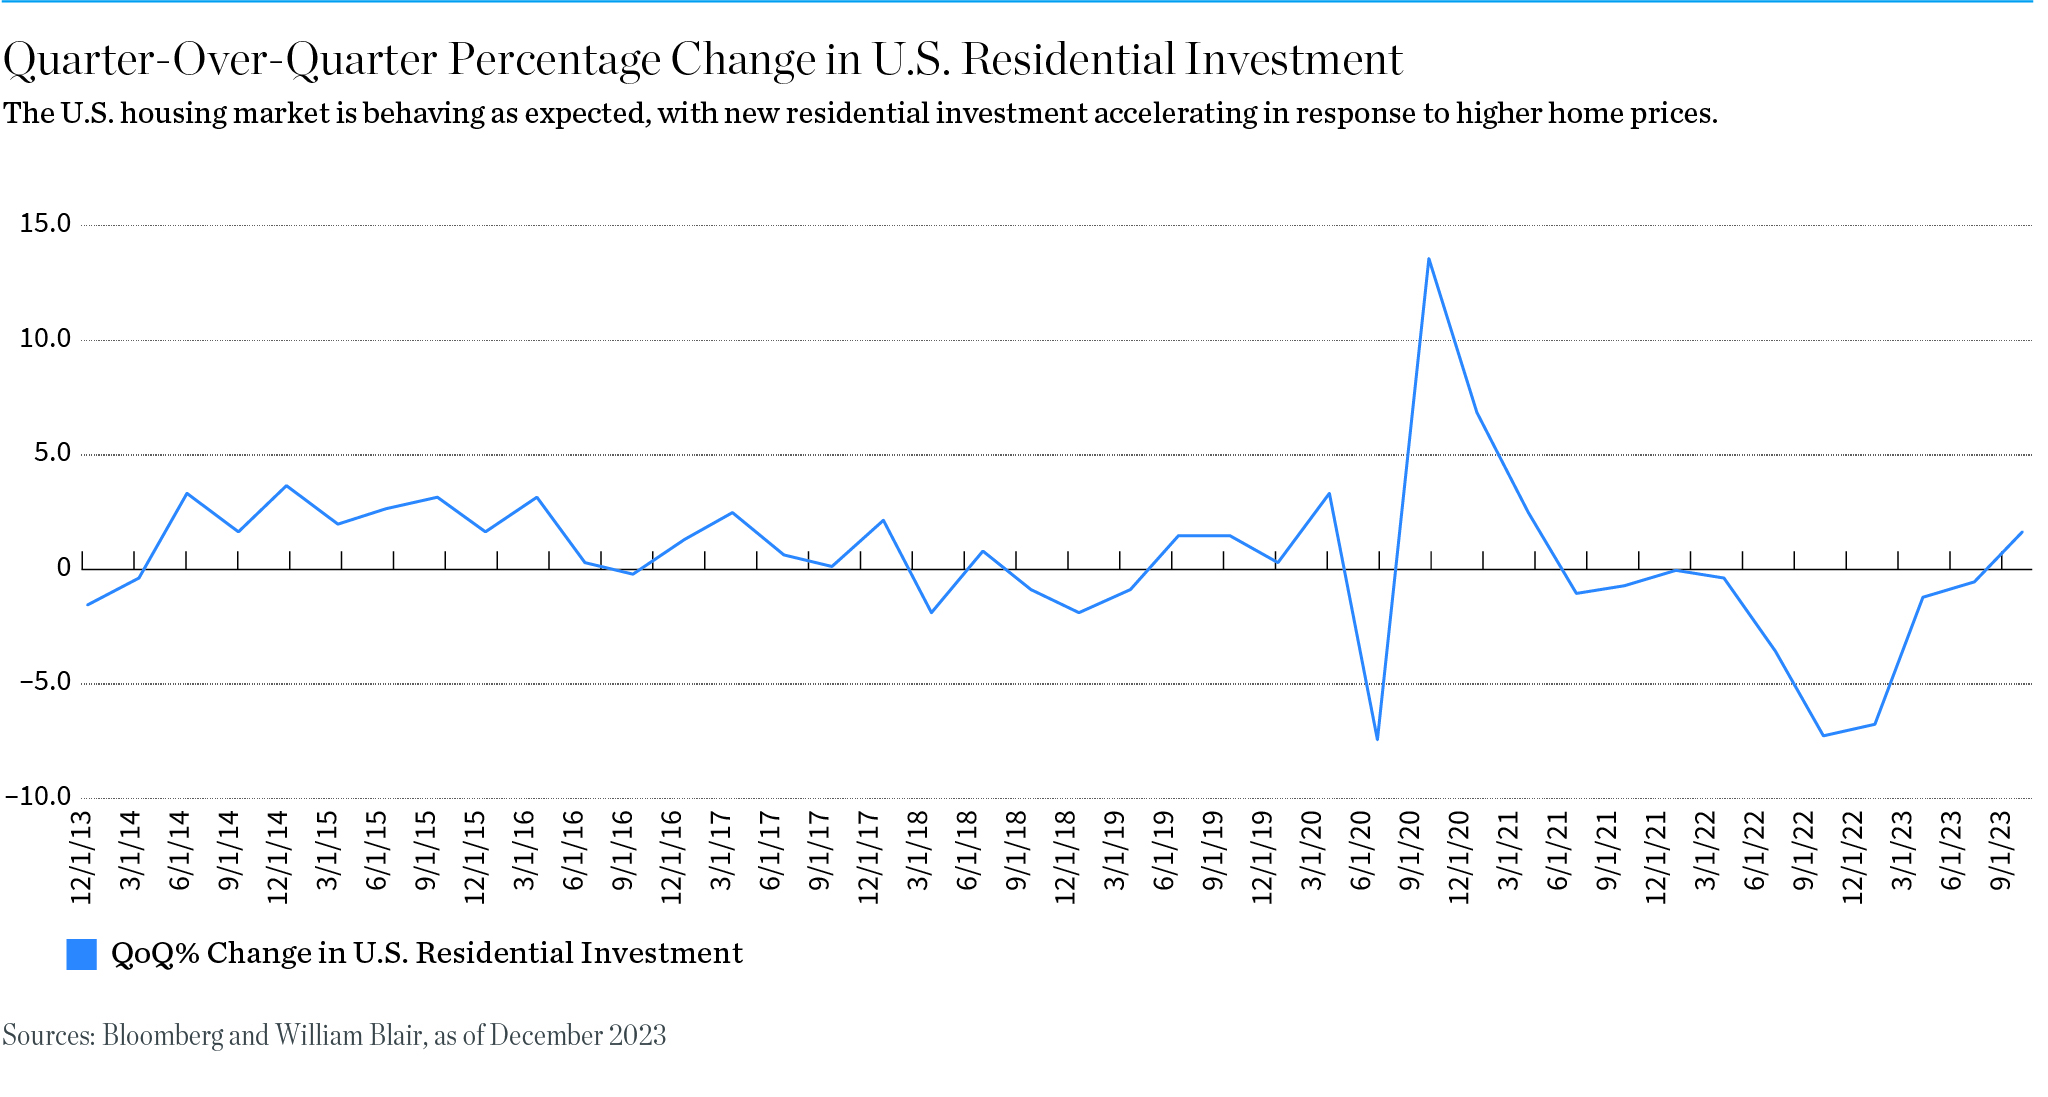
Recent house price increases have motivated more building: residential investment has returned to growth after two years of continuous declines, as shown in exhibit 5. Over time, this is likely to support more housing market activity and mitigate future price increases.
Quarter-Over-Quarter Percentage Change in U.S. Residential Investment
Sources: Bloomberg and William Blair, as of December 2023.
Crucially, the labor market has healed as the postpandemic supply constraints have all but unwound. Wage growth continues to moderate; hourly earnings are now growing at 4%, down from nearly 6% a year ago. The number of job vacancies has continued to decline as the economy has added 150,000 net new jobs per month for most of the second half of 2023. In other words, the returning workers and resumption of immigrant inflows resolved the severe worker supply shortage without any meaningful pickup in unemployment.
Falling inflation is likely to remain a powerful tailwind to consumer spending and, by extension, overall economic growth.
OLGA BITEL, Partner
Falling inflation is likely to remain a powerful tailwind to consumer spending and, by extension, overall economic growth, as moderate wage gains in excess of falling inflation boost real incomes. This dynamic is also playing out in Europe, where the disinflation process commenced later and has further to run. Economic growth is likely to remain more moderate in Europe than in the United States, not least due to significant geopolitical tensions on its borders and meaningfully higher energy prices compared to pre-pandemic levels.
With goods and services prices already converging to pre-pandemic trends, it is not a stretch to assume that U.S. inflation will normalize to its long-term 2% rate in the first half of 2024.
As the disinflation process progresses, current monetary policy will de facto become more restrictive, suggesting that some moderation in the federal funds rate will become necessary even if economic activity remains resilient. The ECB is just as likely to face low inflation and underwhelming growth in Europe within months. Relying on today’s or, more accurately, last month’s indicators of price movements, risks keeping monetary policy too restrictive and punitive for future economic activity. We expect the Fed to bring policy rates down to the 3.5% range on an 18-month view and to begin this process in the first half of 2024.
So, if the Fed adjusts its “neutral” monetary policy stance to be in line with meaningfully lower inflation and does so in a timely manner, and if the ECB follows suit in Europe, the world’s principal demand centers can maintain modest but sustainable economic growth in 2024.
In other words, 2024 may be the first year of “normal” economic expansion post-COVID.
1 Bourses are represented by the DAX Index (Germany), the IBEX 35 Index (Spain), and the FTSE MIB Index (Italy).
2 Japanese equities are represented by the Tokyo Price Index (TOPIX).
The DAX is a stock market index consisting of the 40 major German blue chip companies trading on the Frankfurt Stock Exchange. The FTSE MIB Index is the primary benchmark index for the Italian equity market and represents the large cap component of the FTSE Italia All-Share Index. The IBEX 35 is the benchmark stock market index of the Bolsa de Madrid, Spain's principal stock exchange. The Standard & Poor’s (S&P) 500 Index tracks the performance of 500 large companies listed on stock exchanges in the United States. The Tokyo Price Index (TOPIX) is a metric for stock prices on the Tokyo Stock Exchange (TSE).
Index performance is provided for illustrative purposes only. Indices are unmanaged and do not incur fees or expenses. A direct investment in an unmanaged index is not possible.


