


Market volatility can cause even the most experienced investors to feel unsettled, and market downturns make it harder to stay invested, especially when eye-catching headlines become disconcerting.
While volatility can be worrisome, historically, it’s not unusual, and market corrections are a critical part of long-term investing. Understanding market indexes, trends, and resources can help you plan for times of heightened volatility.
Understanding the VIX
The CBOE Volatility Index (VIX) measures expected volatility in the stock market, using aggregated weighted prices of 30-day buying and selling options in the S&P 500 index. Commonly used to gauge Wall Street’s fears, a high VIX signals rising market concerns and unsettled sentiment among investors.
Since 1990, the average VIX reading has been 19.5, with the highest reading since then occurring during the COVID-19 pandemic, when the gauge hit 82.7 in March 2020.
In early August, the VIX ascended over 65 due to concerns about global market performance, worries about recession, and worse-than-expected U.S. jobs data. The spike rivaled highs during the 2008 financial crisis and the start of the COVID-19 pandemic. Within just a few weeks, however, the VIX corrected and fell over 50 points in just two weeks, marking its fastest-ever retreat.

Today’s Market Dynamics
While market volatility has always been a consideration for investors, today’s dynamics seem to create more sensitivity than ever before. One key feature of the market over the last year is that it’s driven by a handful of extremely large technology stocks, explained William Blair’s Richard de Chazal, CFA, macro analyst. When market breadth is low, it can often lead to periods of increased volatility.
“While most of these stocks have been making spectacular earnings and revenue gains so far,” de Chazal said, “investor expectations around future gains are high. As we’ve seen, any slight miss on those earnings can lead to very outsized movements in price, which can drag the aggregate market down.”
These periods of heightened volatility are also of concern to the Federal Reserve, de Chazal explained. Changes in financial conditions are the mechanisms central banks use to effect their desired economic changes.
“Volatility can tighten—or ease—financial conditions more than the Fed feels might be justified,” de Chazal said. “They must strike a balance between responding to events during market crises and being overly eager to support the market during volatility.”
The Fed’s first step is typically to assess the nature of the volatility; its response often tells the market that it’s prepared to act should it feel the need. While some market commentators called on the Fed to immediately cut interest rates back in August, de Chazal believed it managed the situation adeptly by letting the market naturally correct.
Looking at the Months Ahead
While political elections in the U.S. are known events occurring every four years, a heightened level of uncertainty accompanies them. Geopolitical tensions combined with recent elections’ political partisanship cause investors to become more focused on the effects of the election’s outcome for the economy.
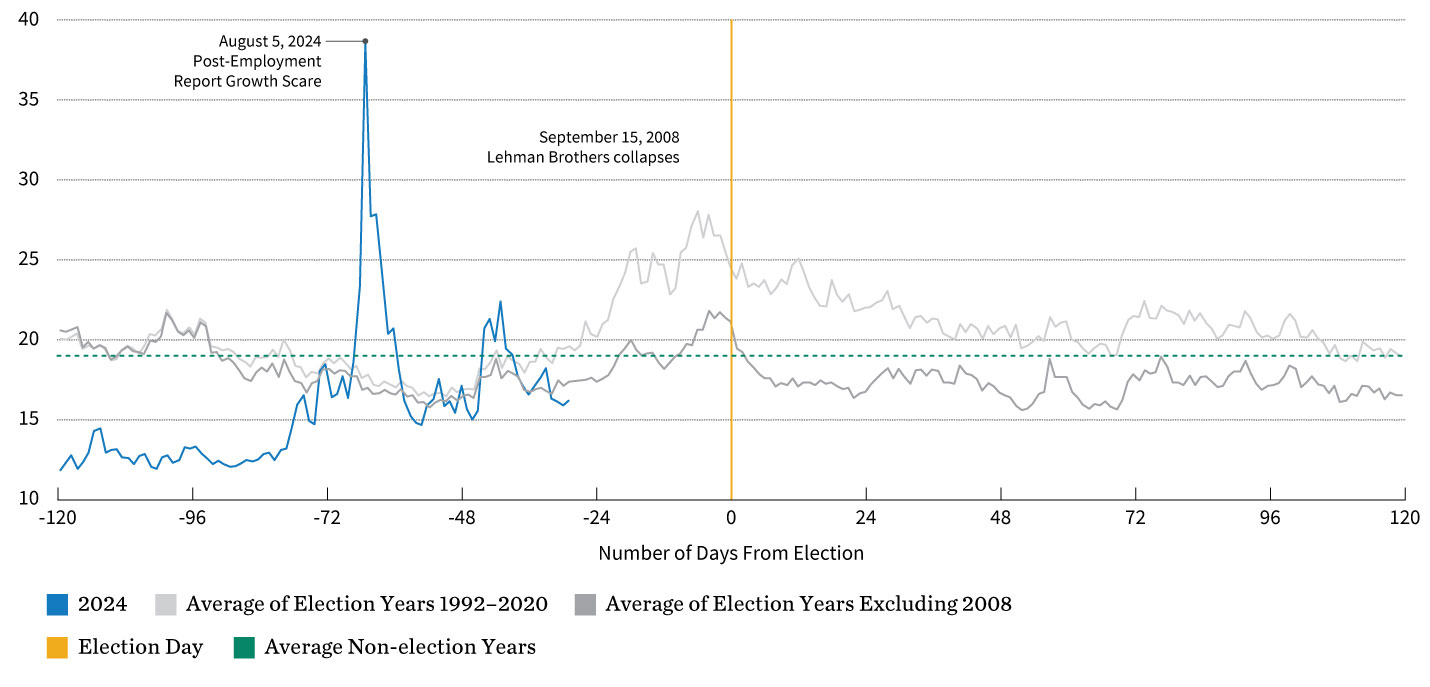
Looking at the VIX during election years from 1992 to 2024, de Chazal explained that future market expectations of volatility tend to be slightly higher, with an average reading of 20.6, whereas the VIX averaged 19.0 in non-election years.
“Most of the volatility takes place in September, October, and November,” de Chazal said. “The exhibit below shows that the current trend has roughly matched the historical trend, excluding 2008, which was marred by the collapse of Lehman Brothers. If this continues to be the case, however, we should expect to see volatility moving higher over the upcoming months.”
Understanding the potential upticks in volatility may allow investors to better mitigate fears and take advantage of any opportunities that may arise as a result of temporary market dislocation.
VIX Volatility Index During Election Years 1992–2024
Navigating Tough Markets
At William Blair, we track the VIX’s behavior as a way to measure sentiment among investors. While volatility is part of long-term investing, navigating tough markets is a hallmark of William Blair’s history, and we’re committed to meeting clients’ needs and goals. Please contact your William Blair wealth advisor with any questions.