Economic growth in 2024 was much better than feared, and while plenty of uncertainty exists about future trajectory following the U.S. elections in November, the base case remains one of further modest deceleration in growth and inflation.
2024 marked a second consecutive year of above-20% returns in the broad equity market indexes. With valuations already elevated for the larger-cap stocks, market performance will need to be driven more by earnings growth than multiple expansion. Investors should also be looking to take a more active management approach by diversifying to other higher-quality and attractively valued segments of the market.
The Fed feels the economy is in a good place, and the economic outlook is consistent with further rate cuts by the central bank, as it seeks to ease policy restrictiveness without adopting an outright accommodative policy stance.
Sticking With Durable Franchises
Just like the durable franchise companies we like to invest in, we are pleased to note that this January, William Blair celebrates its 90th anniversary. The company was founded by William Blair in 1935—in the midst of the Great Depression and not far off the bottom of the historic market crash of 1929—and it has been investing in growth stocks ever since.
We are proud of our stability, our culture, and our consistent focus on our clients, and are especially grateful at this milestone for the trust you have placed in us over these many years. We look forward to sharing many more such milestones with you in the future.
Economic Growth and 2025 Uncertainty
The consensus amongst economists at this time last year was that there was a 55% probability of a recession in 2024, which was better than the 65% predicted in June 2023 but still worryingly high. The yield curve was deeply inverted in January 2024, the manufacturing sector had been in a recession since the previous year, and it was expected that the lagged impact of the significant Fed tightening would start to firmly bite once consumers had polished off the last of their pandemic-related excess savings and most of the pent-up demand for consumer services (the so-called revenge spending) was fully satiated.
A recession did not come to pass, however the economy grew by (a currently estimated) 2.7% within the year, and inflation continued to drift lower, from 3.1% in December 2023 to 2.4% by September 2024 (now back to 2.7%). The disinflation allowed the Fed to start cutting rates in September, with its main policy rate finishing the year 100 basis points lower than at the start.
Economists have reassessed their view as to the economy’s underlying strength and are now attaching just a 20% probability to a recession in 2025. This includes an estimated deceleration in growth to 2.1%. Inflation, however, is likely to remain sticky, with an expected deceleration to a still-above-target 2.5% by year-end.
It is also the reality that greater uncertainty is found with economic forecasts following key elections. President-elect Trump’s election mandate included a series of measures, such as tariffs, deportations, tax cuts, deregulation, and government spending reductions, which, if enacted to the extent described, could have some big implications for both growth and inflation—with deportations and tariffs being the most significant. As much as companies might enjoy the potential for greater deregulation, the lack of clarity into the outlook for other policies will also have a dampening impact on economic activity until they are resolved.
The inflationary impact of rebuilding after the devastating California wildfires could be a trickier one to negotiate for the Fed, as this is just another in a series of what have been “one-off” events causing spikes in inflation. In the past, with regard to events such as Hurricane Katrina, the Fed chose to “look through” these as temporary supply shocks and not “too much money chasing too few goods.” This might be different today if consumers start to see these as being less-isolated blips and increasingly as inflation simply being permanently higher. If that is the case, the Fed will then need to balance any potential adverse shifts in longer-term inflationary expectations against the adverse impact that higher rates (or fewer cuts) might have on aggregate growth. The rebuilding process will take years in California, at a time when labor markets are already stretched and housing is in short supply.
Market Returns Past and Future
U.S. equity market performance in 2024 was once again dominated by just a handful of mega-cap growth stocks—the Magnificent 7 (see exhibit). These stocks rose by an average of 60.2% in 2024, compared to a still very respectable (but nevertheless much worse) 12.1% for the remaining 493 companies in the S&P 500 index. As we’ve seen in concentrated markets of the past, these “crowded trades” in so few stocks can unwind quickly. The volatile trading in shares of Nvidia on news of lower-cost competitive threats from China in recent days highlights this risk.
S&P 500 vs. Magnificent 7
(Indices Rebased to 100, 28 December 2023)
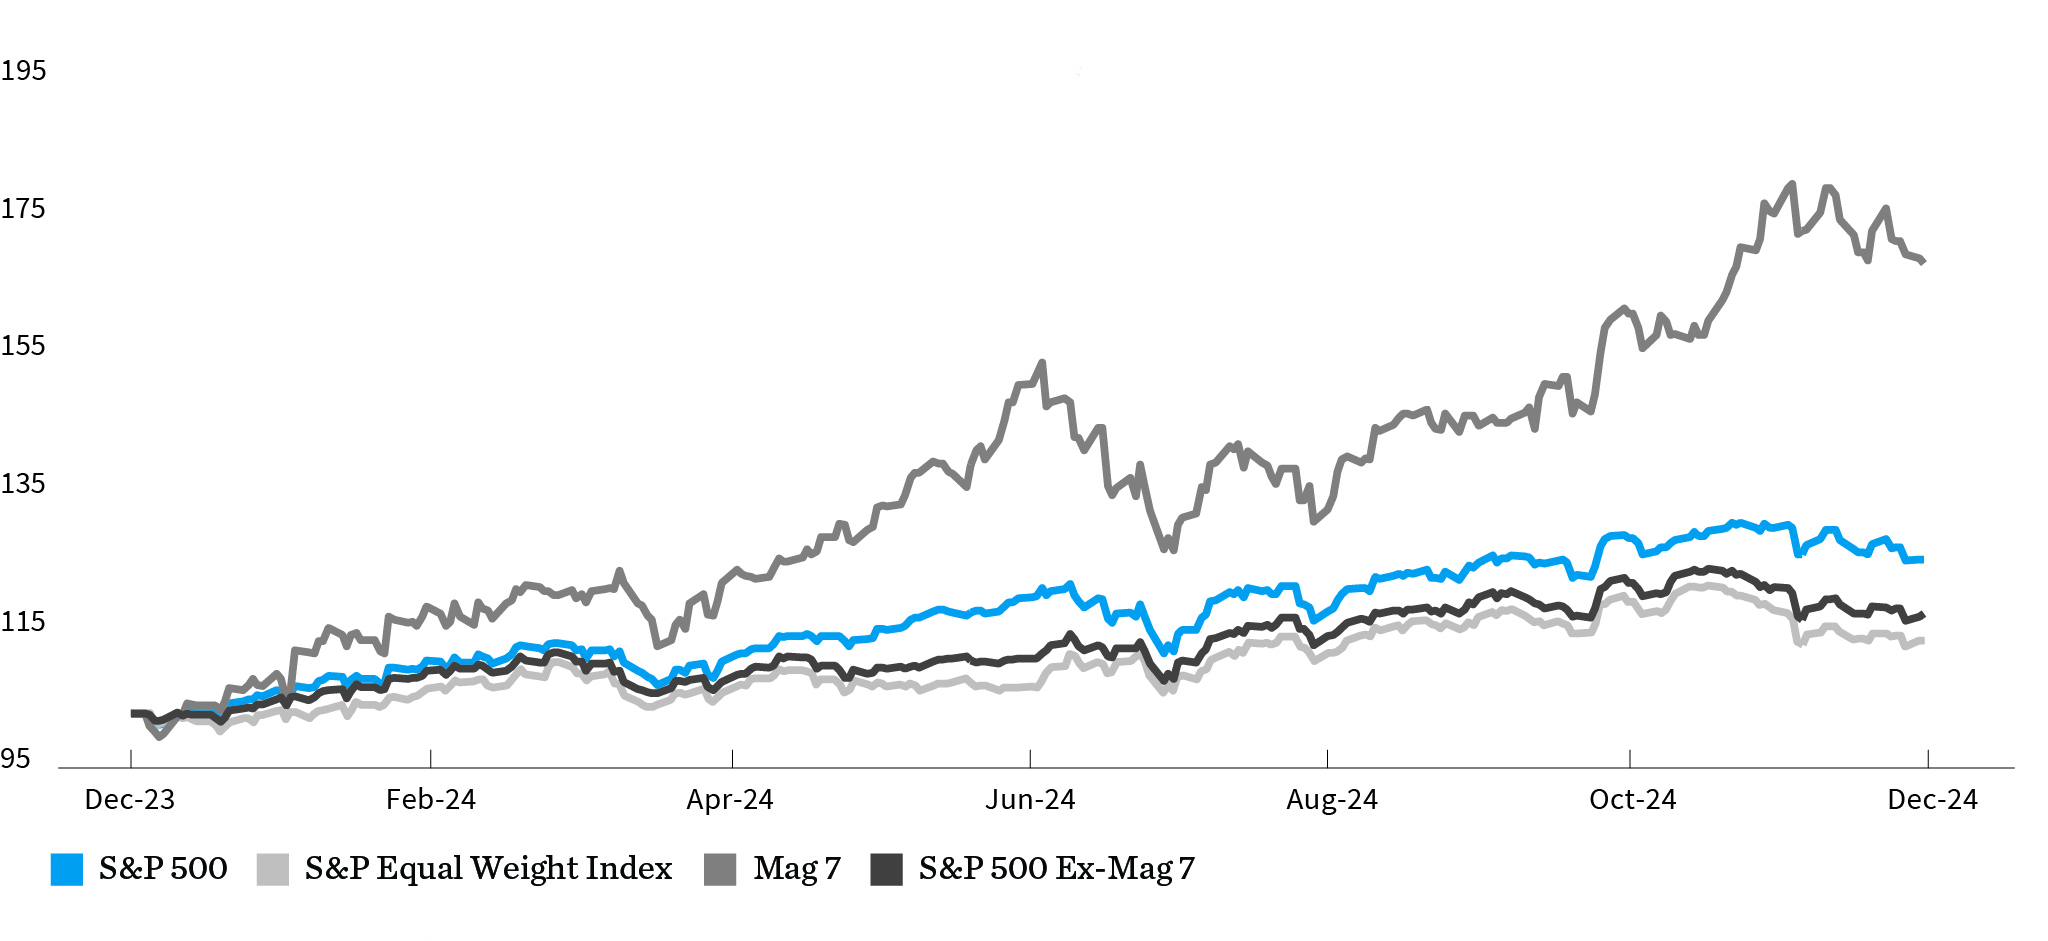
The aggregate index total return was 25%, which was strikingly similar to the 26.3% in 2023. The last time the market experienced at least two consecutive years of above-20% returns was the 1995-1999 period when all five years were above 20%.
What might we expect to see in 2025? To assess this, we need to break down where returns come from in the first place. For example, 2024’s 25% total return can be described as the sum of the dividend yield in the year (1.3%), inflation (3%), real earnings growth (6%), and the change in the P/E ratio or multiple expansion (13%).
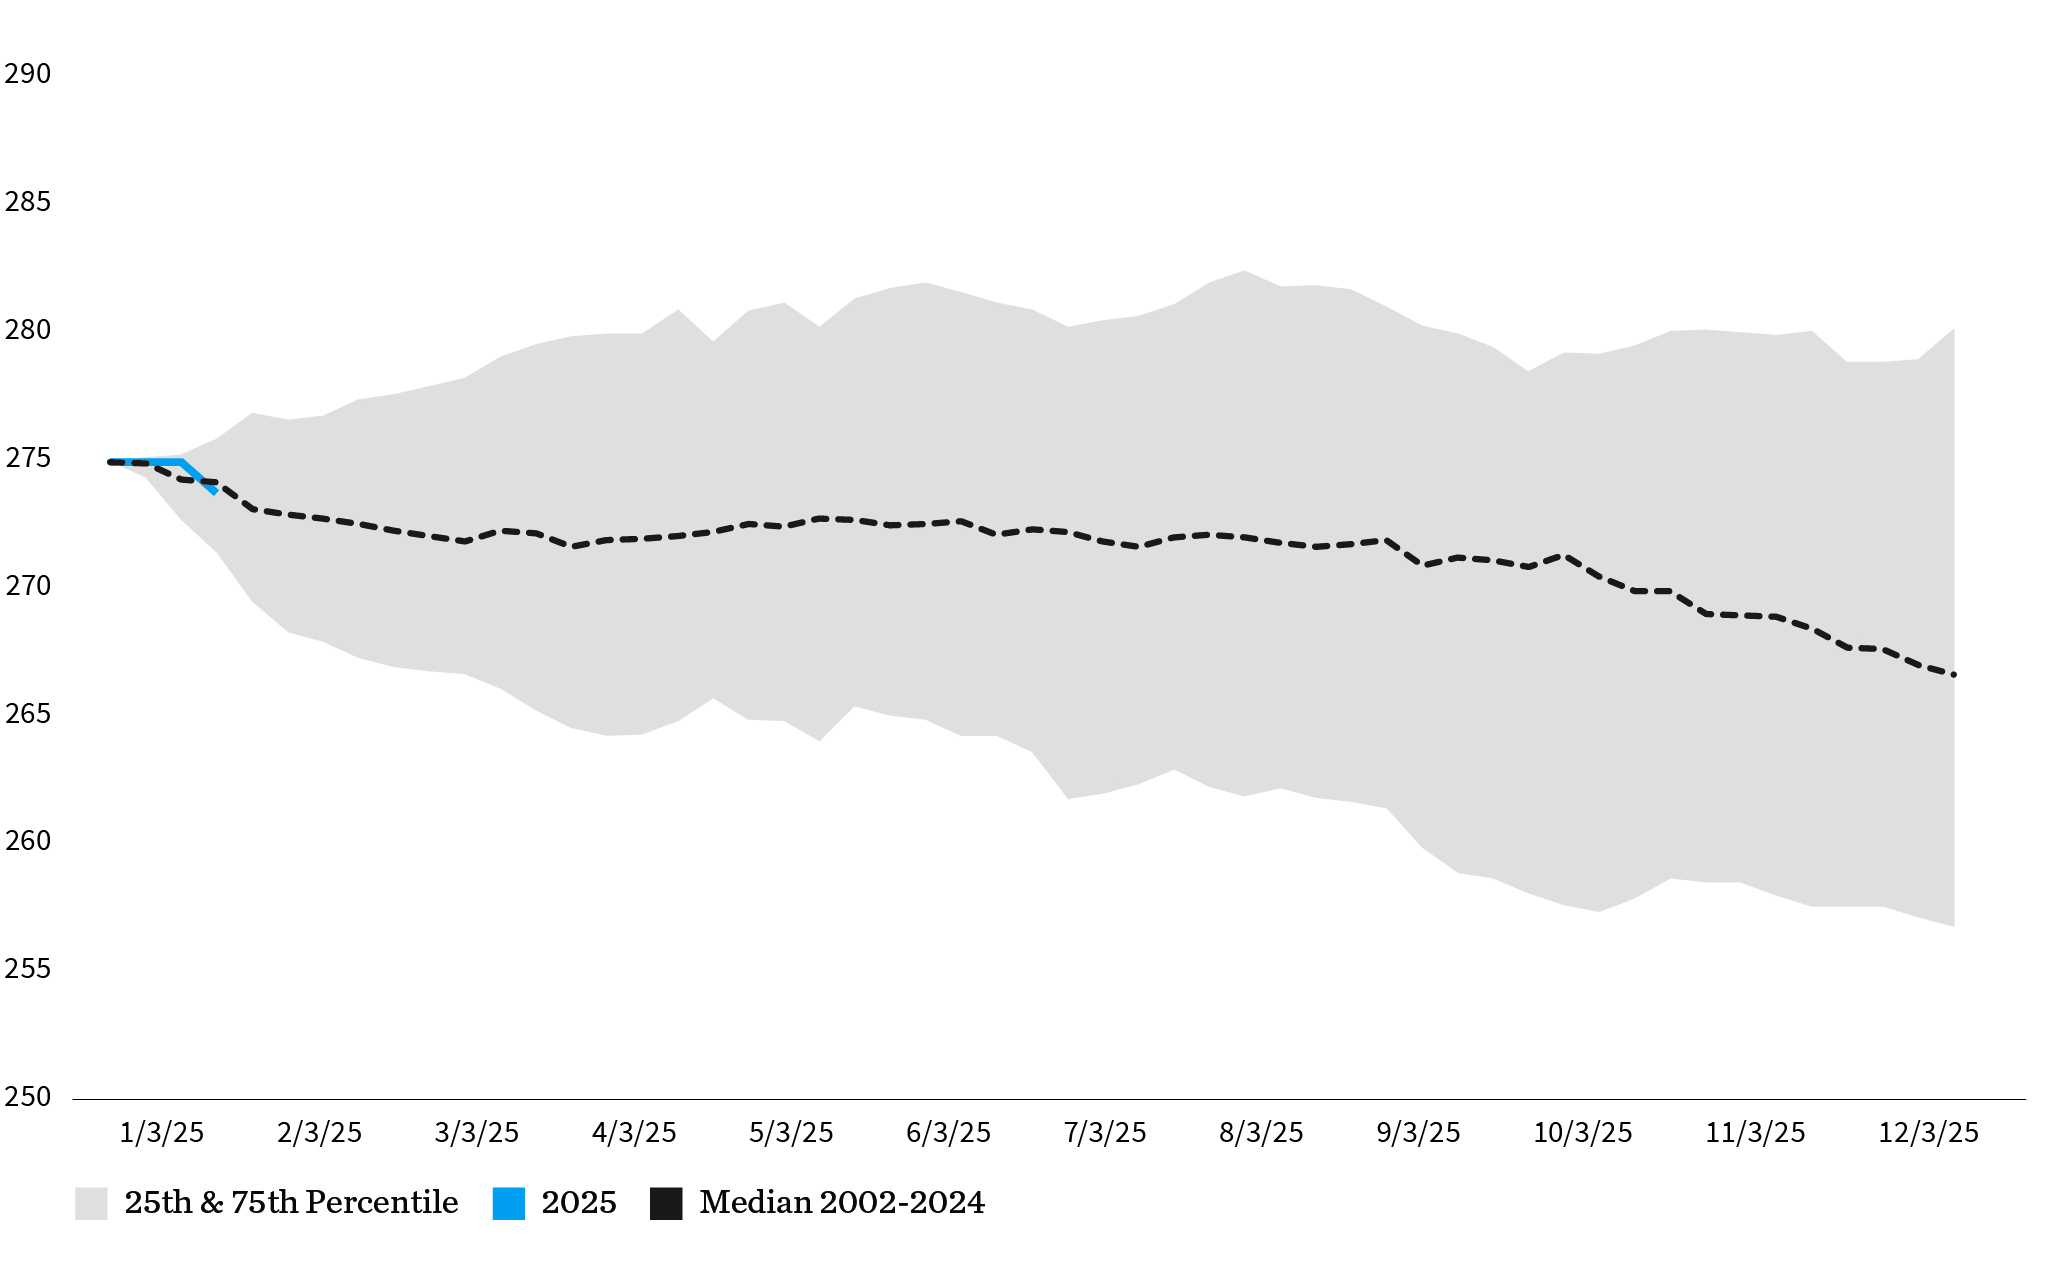
If we assume a similar dividend yield in 2025 of 1.3% and inflation of 2.5%, we are left with estimates of real earnings growth and multiple expansion or contraction. The current consensus is that earnings will grow by 12.5% in 2025. What we also know is that these estimates tend to deflate over the course of the year by a median of 2.4%, as depicted in the following exhibit. Assuming the same for this year brings us to an EPS growth rate of around 9%-10%.
Progression of S&P 500 2025 EPS Estimates, 2025 vs. Median 2002-2024
(Rebased to Estimate at end of Q4 2024 of $275.05 per share)
What requires a little more guesswork is what happens to the P/E multiple. At a current 21.4x 2025 EPS (24.1x trailing-12-month EPS) and an estimated 20.2x 2026’s earnings, this year’s forward multiple is more than one standard deviation above the historical average of 16.4x. This tells us that this year, earnings growth will likely need to do all the heavy lifting in terms of market return, as opposed to the strong contribution from multiple expansion over the previous couple of years.
Two areas we continue to find particularly attractive looking into 2025 are higher-quality small- and midcap segments within the equity market. As we’ve discussed, these are areas of the market that have been widely ignored over the last few years, and where valuation ratios remain historically attractive, having seemingly already priced in plenty of bad news. If we are right, as investors increasingly decide to seek some diversification and take a more active approach to portfolio management in 2025, we could see some strong performance from this area of the market.
The Fed Still Has Room to Lower Rates
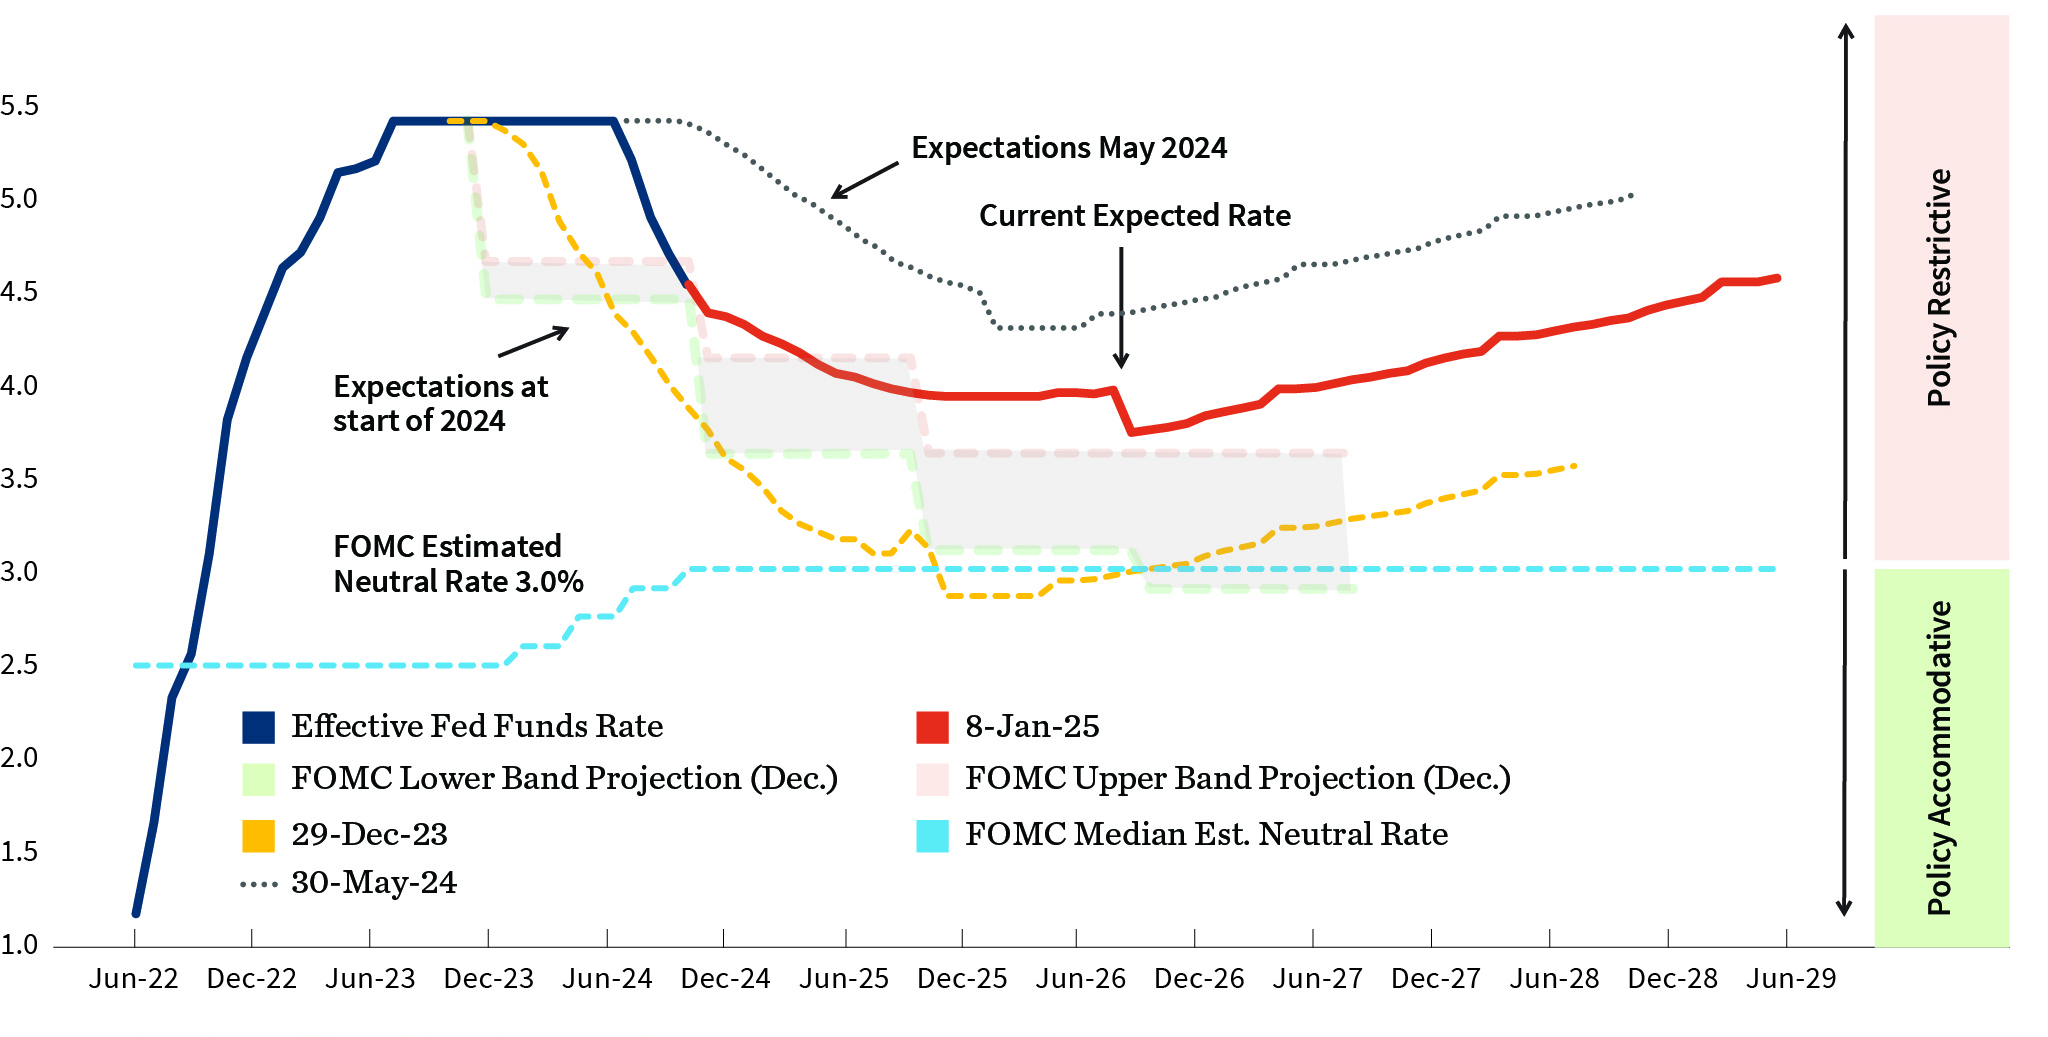
The above-mentioned smid-cap segments of the market are also likely to be supported by further expected rate cuts from the Federal Reserve. While the market is no longer expecting the Fed to lower rates by as much as it was previously, further cuts are still very likely.
Fed Funds Rate Futures Market Expectations & FOMC Projections, %
| Index | YTD | 4Q | 1Y | |
|---|---|---|---|---|
| S&P 500 | U.S. Large Cap | 25.02% | 2.41% | 25.02% |
| DJIA | U.S. Large Cap | 14.99 | 0.93 | 14.99 |
| Russell 3000 | U.S. All Cap | 23.81 | 2.63 | 23.81 |
| Russell 2000 | U.S. Small Cap | 11.54 | 0.33 | 11.54 |
| MSCI EAFE | Developed International | 3.82 | -8.11 | 3.82 |
| MSCI EM | Emerging Markets | 7.50 | -8.01 | 7.50 |
| Bloomberg U.S. HY | U.S. High Yield | 8.19 | 0.17 | 8.19 |
| Bloomberg U.S. Agg | U.S. Core Bond | 1.25 | -3.06 | 1.25 |
| Bloomberg Muni | U.S. Muni Bond | 1.05 | -1.22 | 1.05 |
| MSCI U.S. REIT GR | U.S. Real Estate | 8.75 | -6.12 | 8.75 |
Total Returns
Sources: FactSet, William Blair Equity Research